Progressions- Evolution of Life

http://en.wikipedia.org/wiki/Eadweard_Muybridge#Stanford_and_horse_gaits
In 1878 the above sequence of images was taken by Eadweard
Muybridge to settle a debate among horse racers--when a horse was
galloping full speed, did they ever have all four legs off the ground?
The human eye alone was not fast enough to resolve the dispute.
Muybridge, the photographer who was called in, set up a sequence of
cameras that would be set off by trip wires and found that horses are in
fact completely air born at certain points within a full gallop. (Watch the video of this horse here.)
Based on these images alone, though, how do we know that
the horse was actually running? Couldn't the pictures have been of
different horses? Couldn't they have been jumping and not running?
This is more than just a thought experiment. We're asking if it's
justified to tie different pieces of information together to form a
progression, just like we do in evolution. Below we will explore
several examples of biological progressions and ask what evidence there
is that they represent evolutionary change over time.
Claim: Species have changed over time--descent with modification
Prediction: If evolution is true and
species have changed over time, then we would expect there to be
examples of this preserved in rock strata, across geography, in a lab,
or in recorded history.
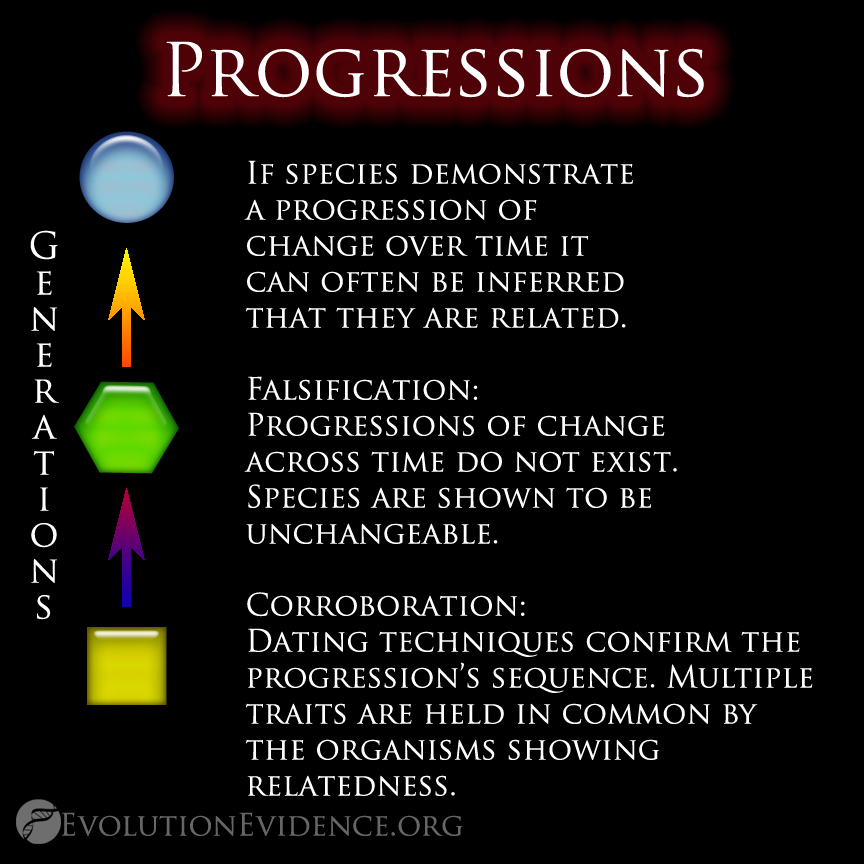
Falsification: Progressions of change across time do not exist. Species are shown to be unchangeable.
Observations: Fossil progressions, microevolution, biogeography (see examples below).
Corroboration: Dating techniques confirms the progression’s sequence. Multiple traits are held in common by the organisms showing relatedness.
Inference: Provided with this gradual
gradation in a trait we can infer that the species are related (though
not necessarily direct descendants--evolution tends to meander).
Examples:
-
Fossil progressions
-
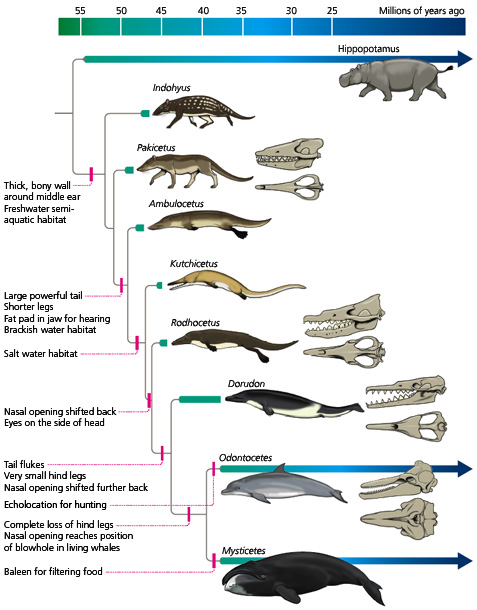
The fossil record demonstrates not only large scale changes across time, phyla, but also within individual species. Three particularly important features are represented within the fossil record. Firstly, the species represented within the fossil record are often vastly different from the life of today. Secondly, is that the the fossils are separately and distinctly layered. Meaning, that we don’t find rabbit fossils in the Pre-Cambrian layers, nor dinosaurs mixed in with mammoths. Lastly, both on the macro and micro scale of the fossil record we see trends of change that progress through time.
-
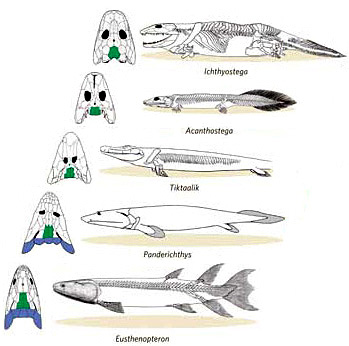
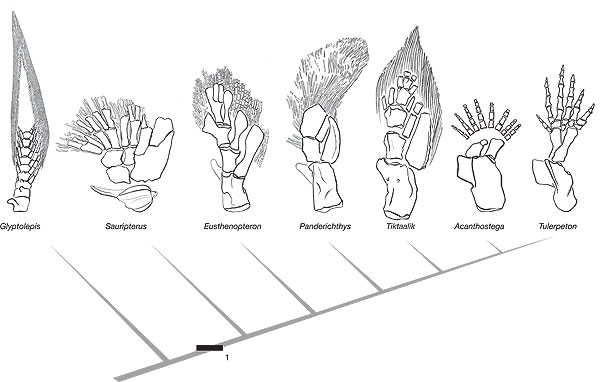
http://evolution.berkeley.edu/evolibrary/article/evograms_03
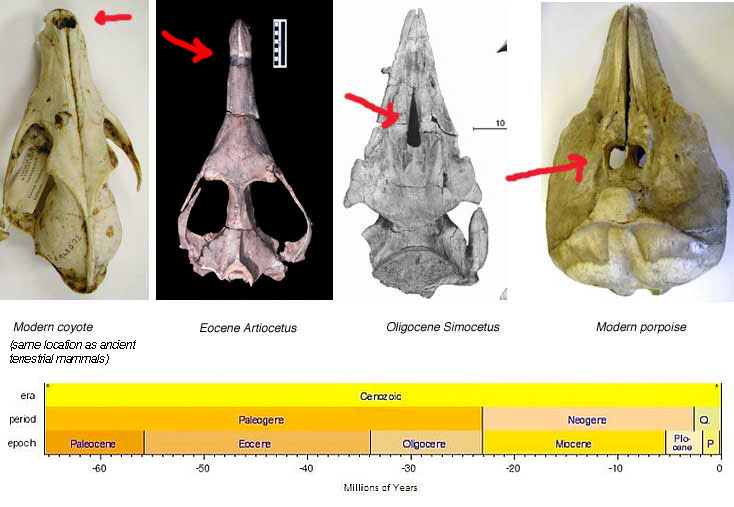
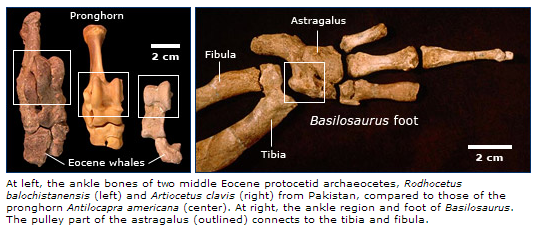
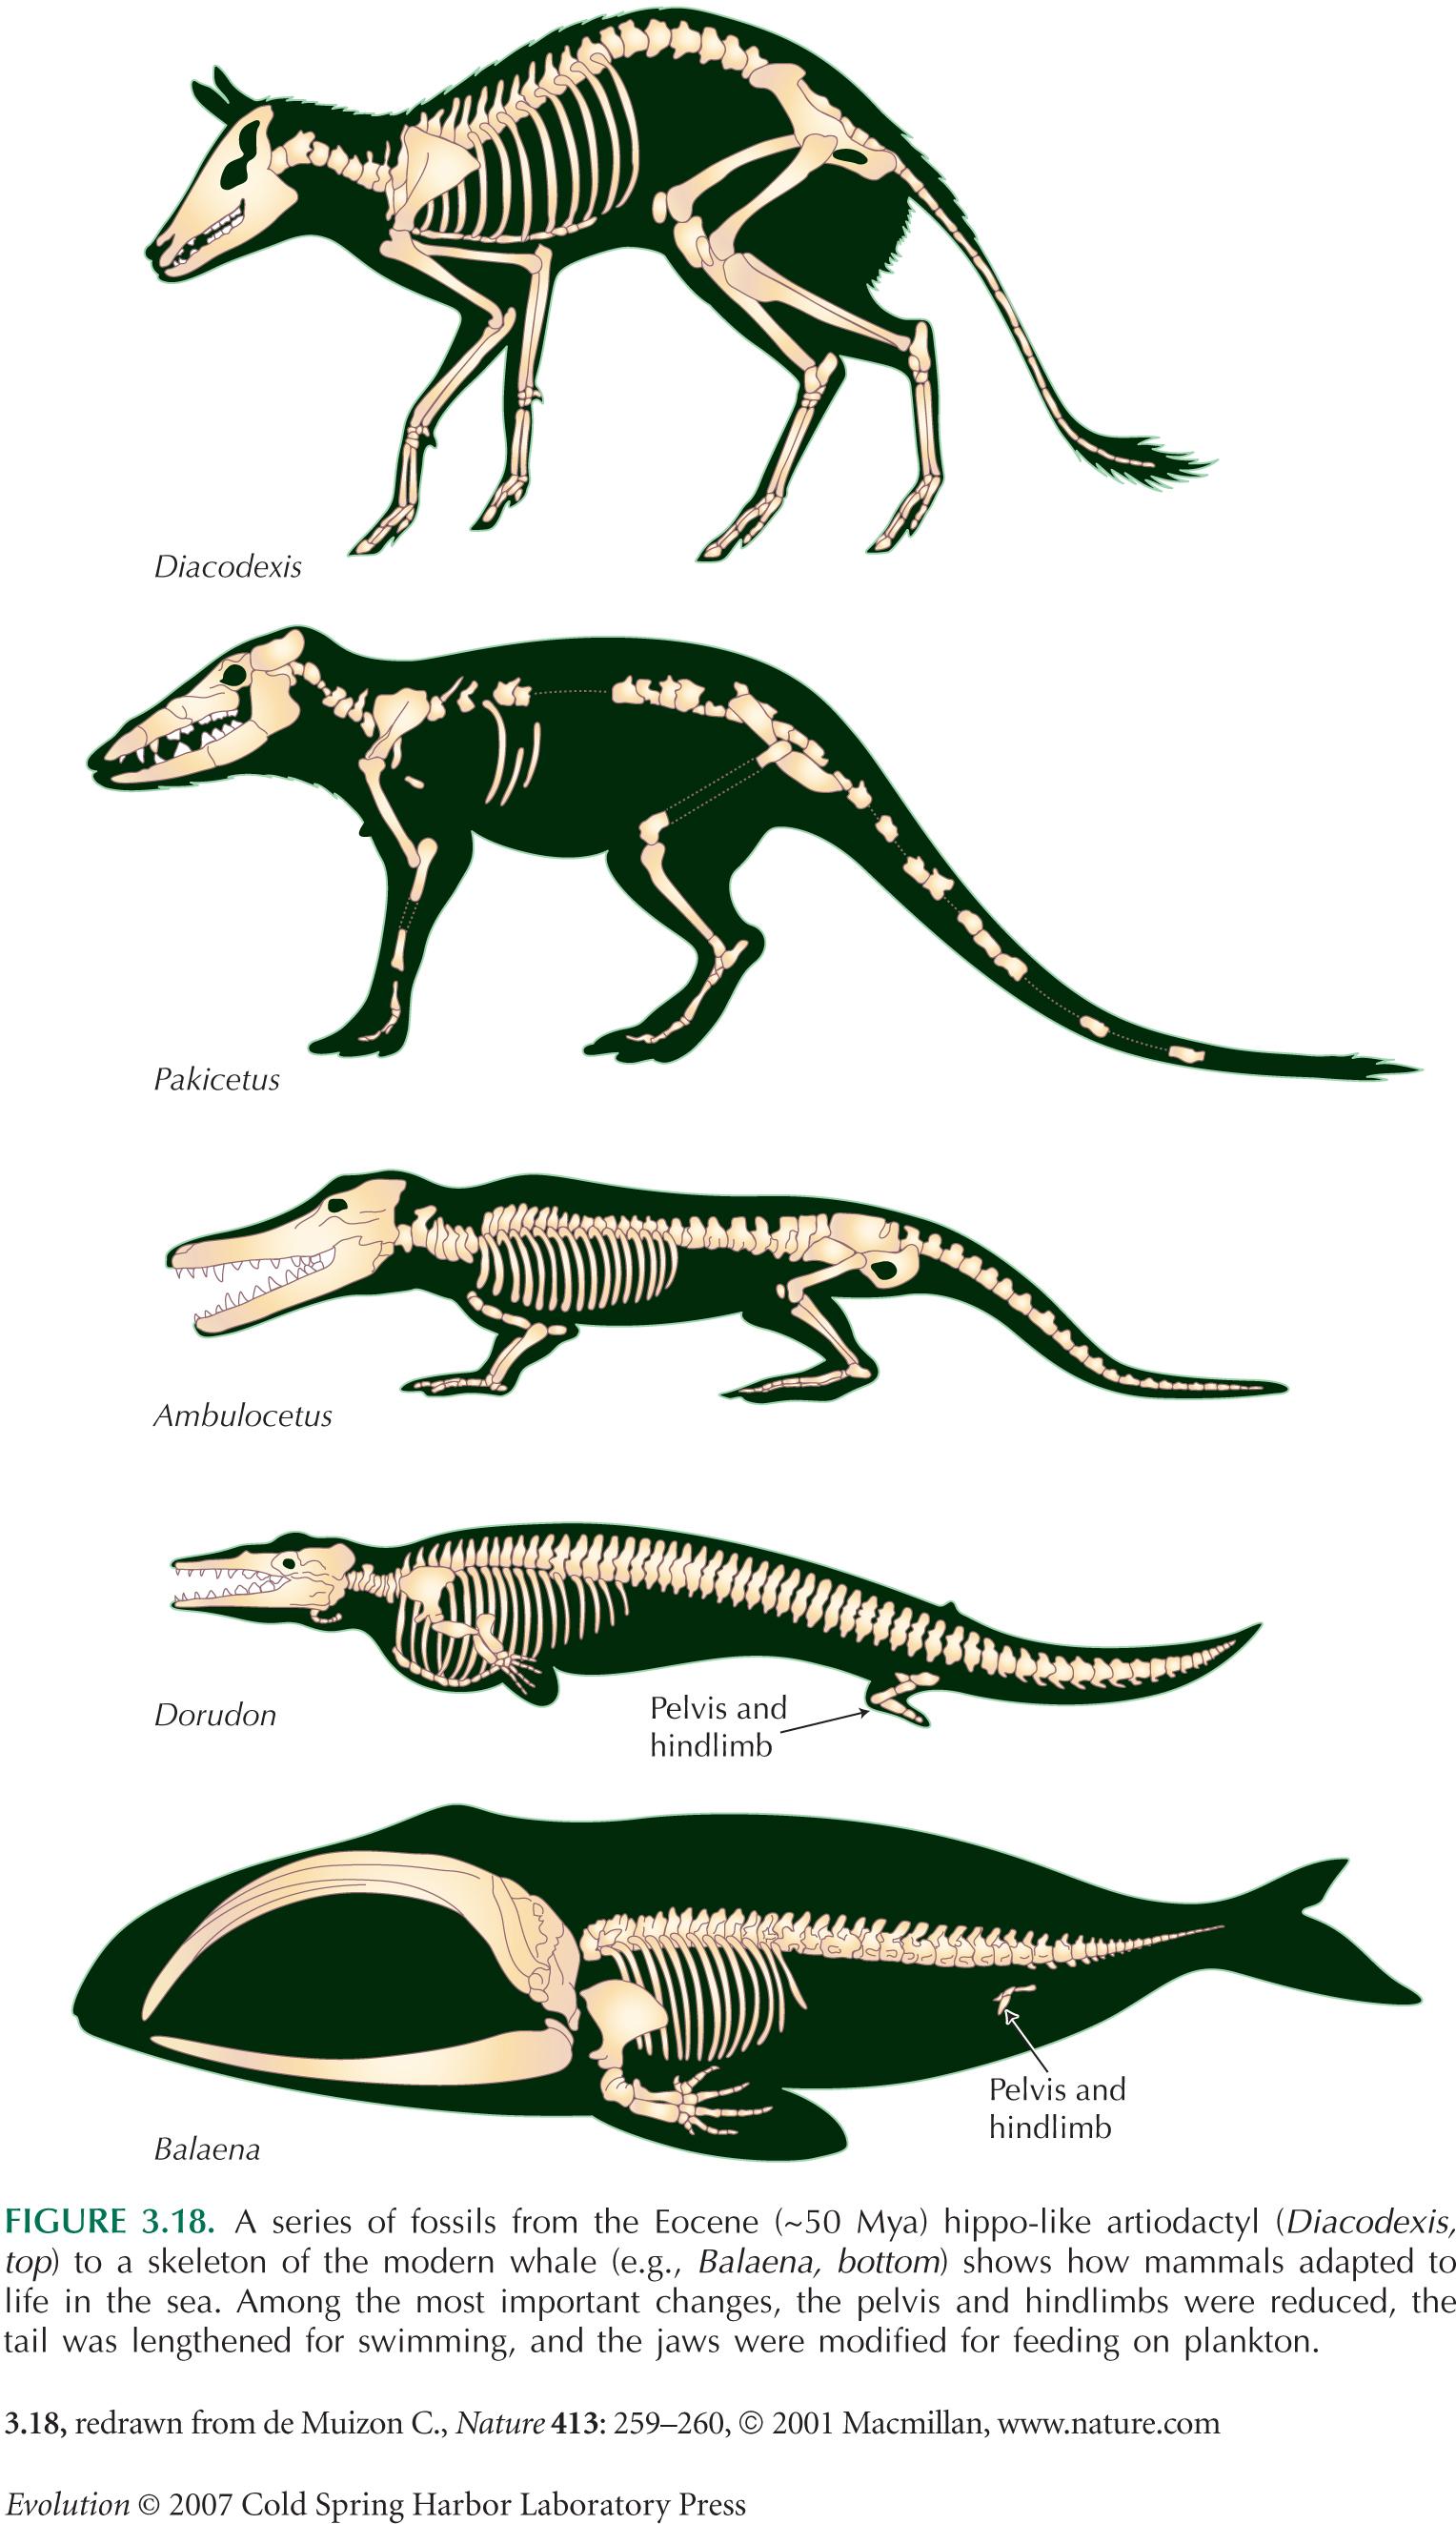 Individual
traits such as leg/pelvis position, nostril location, and ankle bones
can also be traced back to the early artiodactyls that led to modern day
whales.
Individual
traits such as leg/pelvis position, nostril location, and ankle bones
can also be traced back to the early artiodactyls that led to modern day
whales.
http://www.bio.georgiasouthern.edu/bio-home/harvey/lect/lectures.html?flnm=evel&ttl=Evolution&ccode=el&mda=scrn

http://tinyfrog.wordpress.com/2008/02/01/pz-myers-vs-geoffrey-simmons-discovery-institute/
http://evolution.berkeley.edu/evolibrary/article/evograms_03

This
is another image showing the homology between ancient whale ancestors
(Pakicetus) and modern day even-toed ungulates (like pig and deer). Dogs
were included on the far left as a contrast typical of non-even-toed
ungulates.
http://www.bio.miami.edu/dana/160/160S13_5.html
http://www.bio.miami.edu/dana/160/160S13_5.html

http://scienceblogs.com/loom/2006/08/15/the-origin-of-the-ridiculous/

http://coastalpaleo.blogspot.com/2009_04_01_archive.html
http://scienceblogs.com/pharyngula/2006/05/23/no-genes-were-lost-in-the-maki/

http://whyevolutionistrue.wordpress.com/2010/07/22/baleen-whales-a-lovely-transitional-form/
Original article: http://www.sdnhm.org/archive/research/paleontology/DemereMorphoBaleenTeeth.pdf
Original article: http://www.sdnhm.org/archive/research/paleontology/DemereMorphoBaleenTeeth.pdf

http://www.mberg.com.au/dietary-changes-and-the-evolution-of-the-horse/
http://en.wikipedia.org/wiki/Evolution_of_the_horse

http://en.wikipedia.org/wiki/Evolution_of_the_horse
http://evolution.berkeley.edu/evolibrary/article/evograms_02
 Humans
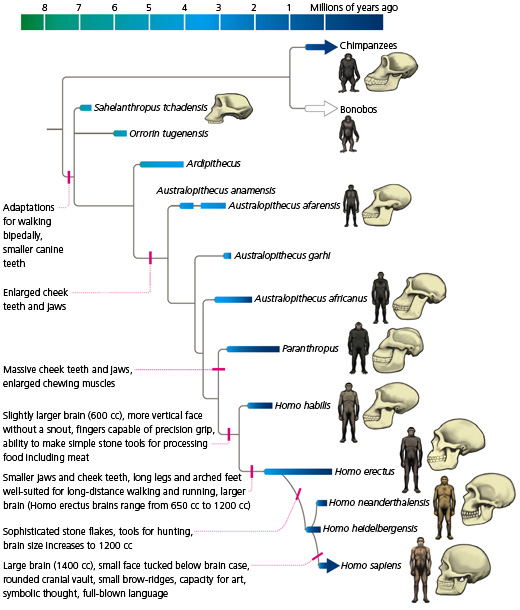
http://evolution.berkeley.edu/evolibrary/article/evograms_07
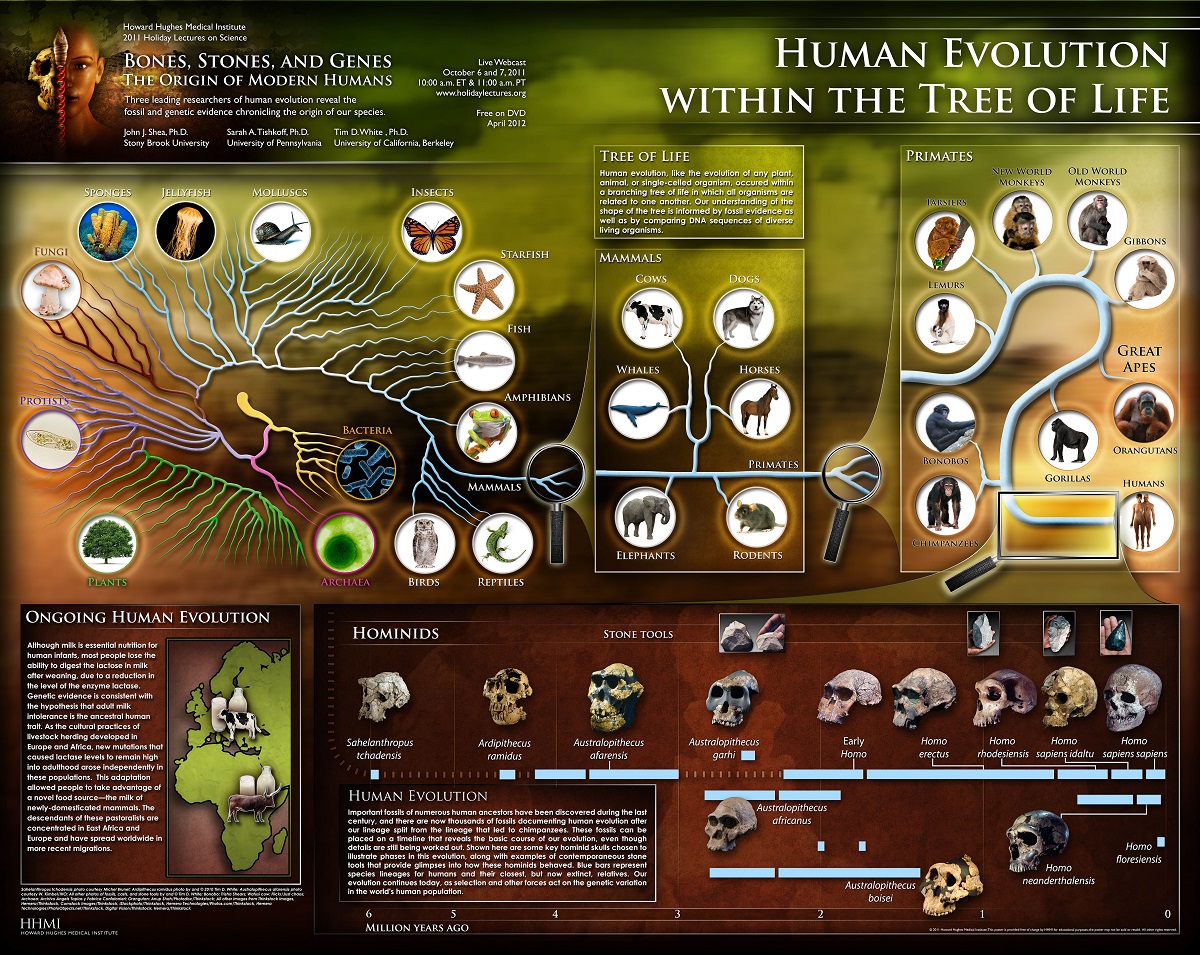
http://media.hhmi.org/biointeractive/posters/2011%20human%20evolution.jpg
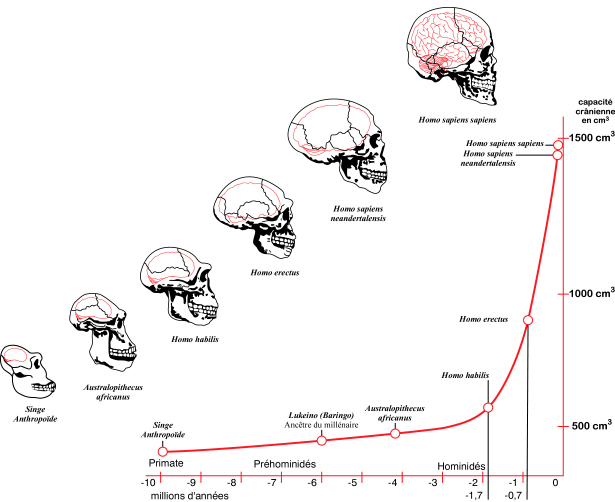
http://distraffscience.blogspot.com/2012/03/overview-of-human-evolution.html
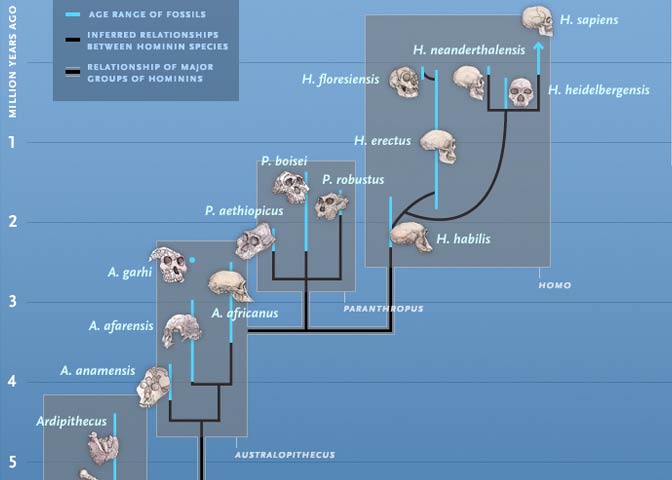
http://www.pbs.org/wgbh/nova/evolution/adaptable-human.html
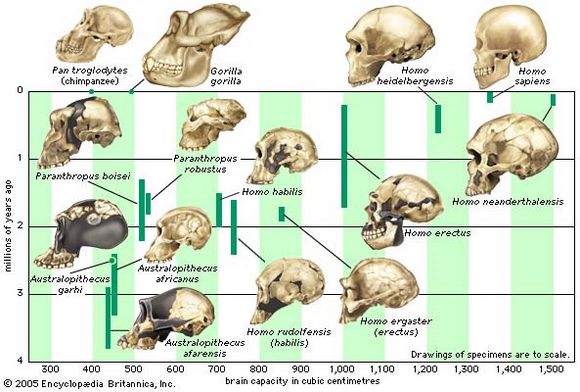
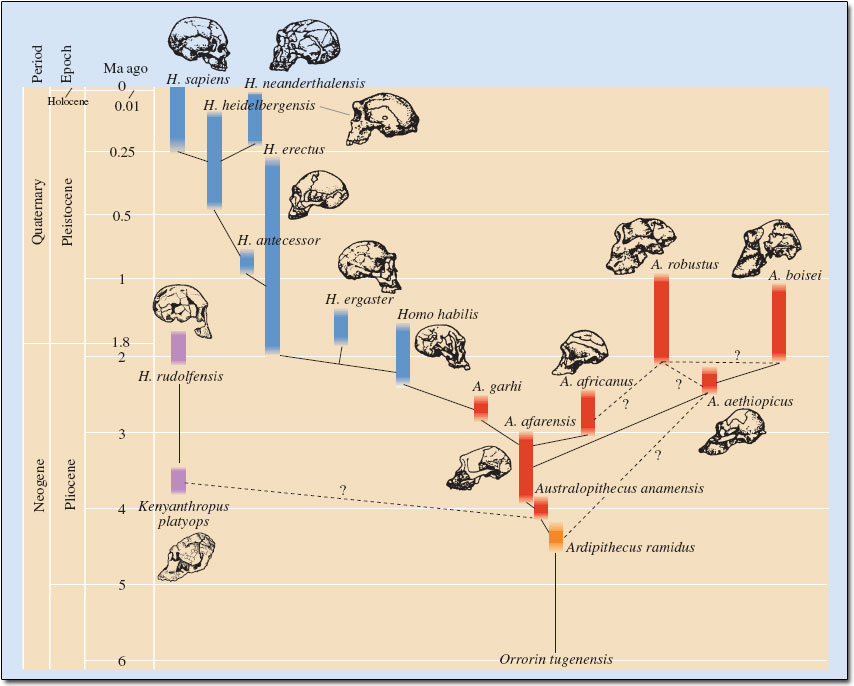
http://scienceblogs.com/laelaps/2007/10/23/troodon-sapiens-thoughts-on-th/

http://visual.ly/timeline-hominid-evolution

Notice
the transition from long scapulas with oblique scapular spines good for
arboreal climbing turned more horizontal as we began to climb and hang
less.
http://openi.nlm.nih.gov/detailedresult.php?img=2860095_10764_2010_9399_Fig6_HTML&req=4http://www.sciencemag.org/content/338/6106/514.figures-onlyhttp://www.sciencemag.org/content/338/6106/478.figures-only
http://openi.nlm.nih.gov/detailedresult.php?img=2860095_10764_2010_9399_Fig6_HTML&req=4http://www.sciencemag.org/content/338/6106/514.figures-onlyhttp://www.sciencemag.org/content/338/6106/478.figures-only

http://evolution.berkeley.edu/evolibrary/article/evograms_06

http://www.nature.com/ncomms/journal/v2/n8/full/ncomms1437.html

http://palaeoblog.blogspot.com/2008/10/gene-expression-in-alligators-suggests.html
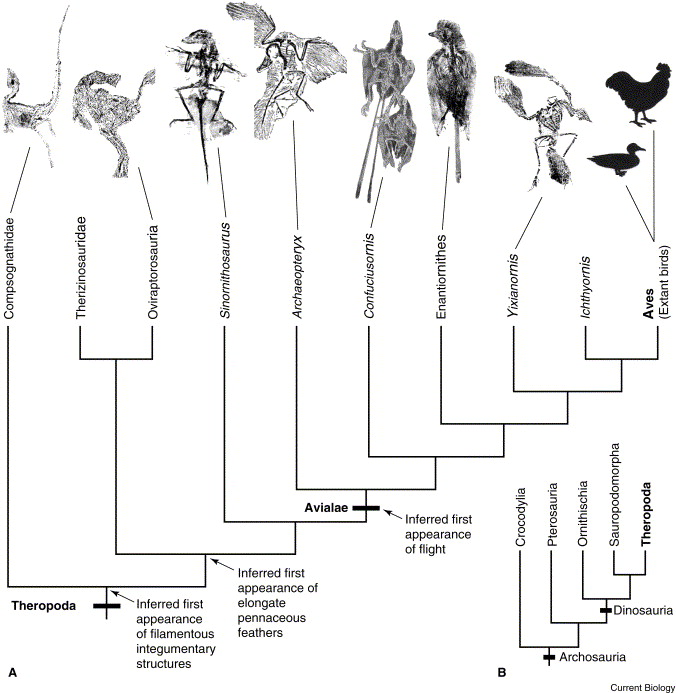
http://ncse.com/rncse/21/5-6/more-birds-dinosaurs

http://www.sciencemag.org/content/333/6049/1619.full
http://emilywilloughby.com/gallery/skeletals-and-diagrams/feather-evolution
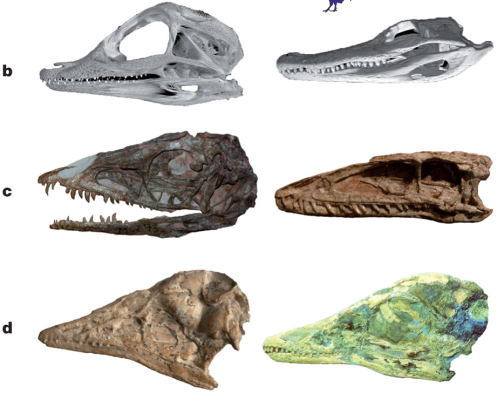
A
common evolutionary strategy to change the phenotype of a species is to
change the developmental progression that leads to that phenotype. This
diagram is showing how bird evolution progressed to have the adult
phenotypes look like the juvenile phenotype of the ancestral species.
http://whyevolutionistrue.wordpress.com/2012/05/28/birds-may-be-paedomorphic-dinosaurs/
Also
http://www.nytimes.com/2012/06/05/science/skull-analysis-charts-the-changes-from-dinosaurs-to-birds.html?_r=0
http://whyevolutionistrue.wordpress.com/2012/05/28/birds-may-be-paedomorphic-dinosaurs/
Also
http://www.nytimes.com/2012/06/05/science/skull-analysis-charts-the-changes-from-dinosaurs-to-birds.html?_r=0
http://www.pnas.org/content/105/14/5430.figures-only
http://www.don-lindsay-archive.org/creation/eocoelia.html
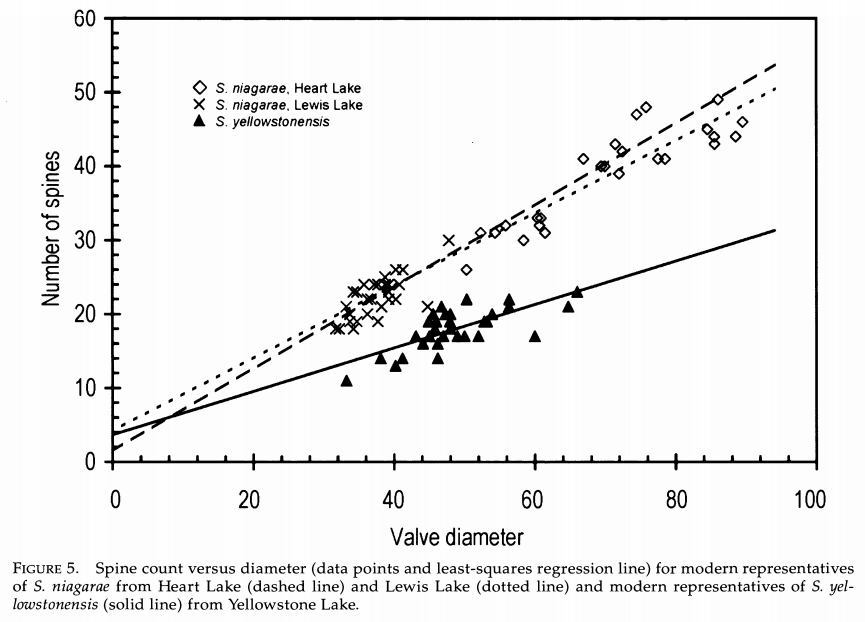
http://www.jstor.org/stable/4096816?origin=JSTOR-pdf
See pictures of diatom spines and valves to better understand what this graph represents: http://westerndiatoms.colorado.edu/taxa/species/stephanodiscus_yellowstonensis
See pictures of diatom spines and valves to better understand what this graph represents: http://westerndiatoms.colorado.edu/taxa/species/stephanodiscus_yellowstonensis


http://evolution.berkeley.edu/evolibrary/article/evograms_05
http://daphne.palomar.edu/ccarpenter/reptile%20to%20mammals.htm

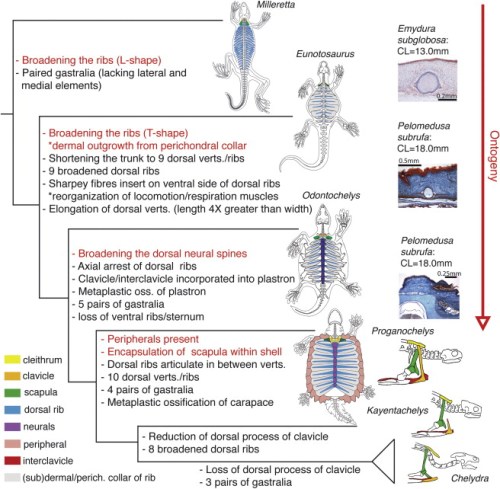
Read more: http://whyevolutionistrue.wordpress.com/2013/06/04/more-about-turtles/
Other resources:
http://whyevolutionistrue.wordpress.com/2013/06/02/turtle-origins/
And
http://www.elsevier.com/connect/how-the-turtle-got-its-shell-clues-revealed-by-fossils
Other resources:
http://whyevolutionistrue.wordpress.com/2013/06/02/turtle-origins/
And
http://www.elsevier.com/connect/how-the-turtle-got-its-shell-clues-revealed-by-fossils
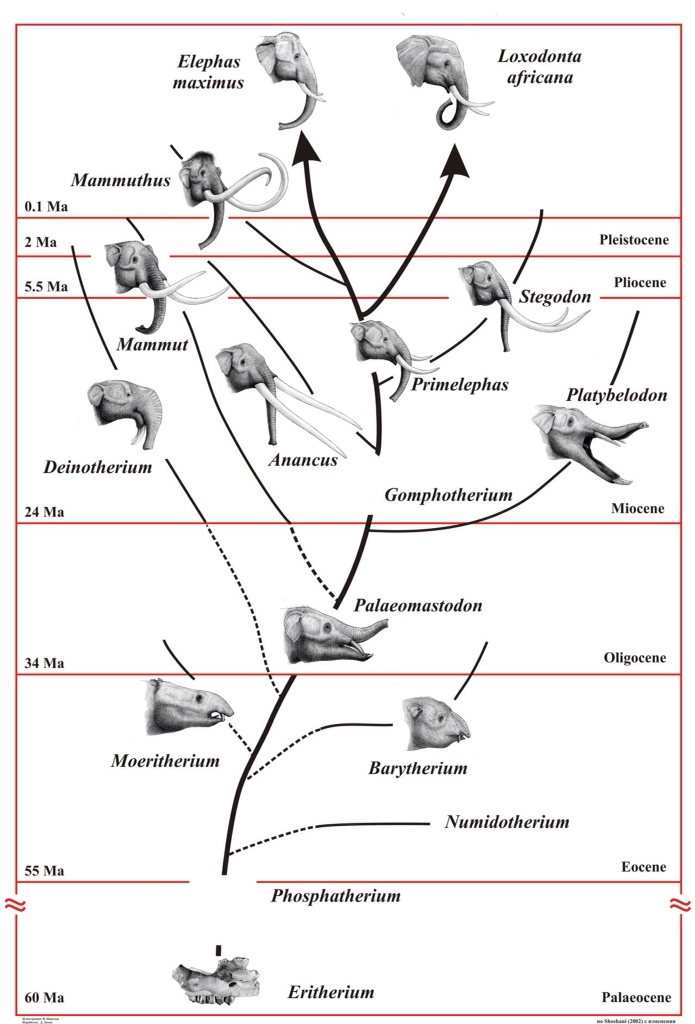
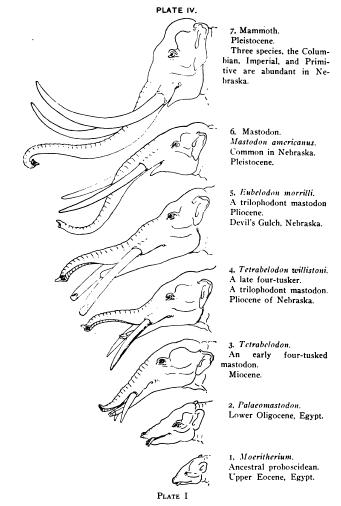
http://perlacopernik.wordpress.com/2012/08/11/the-mighty-elephant-the-real-king-of-the-savanna/
Also interesting:
http://www.sciencemag.org/content/334/6063/1699.figures-only
http://kozmopolitaydinlar.wordpress.com/2012/03/19/5508/fillerin-evrimi-2/
Also interesting:
http://www.sciencemag.org/content/334/6063/1699.figures-only
http://kozmopolitaydinlar.wordpress.com/2012/03/19/5508/fillerin-evrimi-2/
 Microevolution - There have been many instances where the
observed change within a species is fast enough that it can be tracked
by researchers. Extending these trend lines into the future we can see
how major adaptive changes can add up over time.
Soapberry bugs
Microevolution - There have been many instances where the
observed change within a species is fast enough that it can be tracked
by researchers. Extending these trend lines into the future we can see
how major adaptive changes can add up over time.
Soapberry bugs

http://www.evolution-textbook.org/content/free/figures/03_EVOW_Art/08_EVOW_CH03.jpg
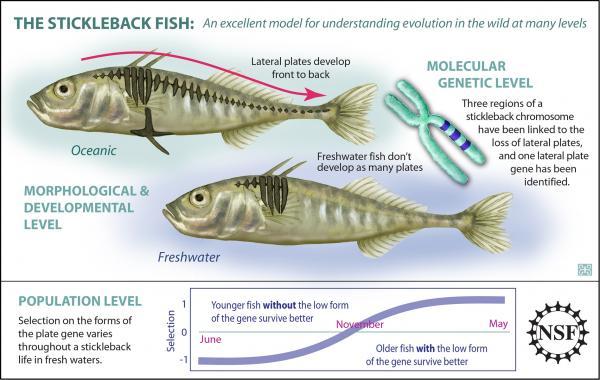
Summary:
Put stickleback fish in a freshwater environment (they were transplants
from salt water, but can survive in both) and over time they lose their
protective, boney plates. They likely do so to conserve energy since
their environment has different predatory pressures and less food during
the winter.
http://www.sciencedaily.com/releases/2008/10/081010100457.htm
http://www.sciencedaily.com/releases/2008/10/081010100457.htm

http://courseconnector.uoregon.edu/bi-131-intro-evolution
"Fig.
2. Evolution of lateral plate morph frequencies in Loberg lake between
1990 and 2007. Besides complete and low lateral plate morphs, we
recognize three intermediate phenotypes described in Bell et al. (2004).
These are "intermediate partials"(IP), partial morphs, and
"intermediate lows"(IL). Notice that the frequency of the three
intermediate phenotypes remained relatively low and constant throughout
the time series."
http://life.bio.sunysb.edu/ee/belllab/loberg.html
http://life.bio.sunysb.edu/ee/belllab/loberg.html

Pink
salmon (Oncorhyncus gorbuscha) are getting smaller. Multiple reasons
are possible but one is that fishermen have been consistently taking the
largest, thus resulting in their reduced size through a form of
artificial selection.
http://www.pbs.org/wgbh/evolution/library/10/3/l_103_02.html
http://www.pbs.org/wgbh/evolution/library/10/3/l_103_02.html

http://www.evolution-textbook.org/content/free/figures/17_EVOW_Art/32_EVOW_CH17.jpg
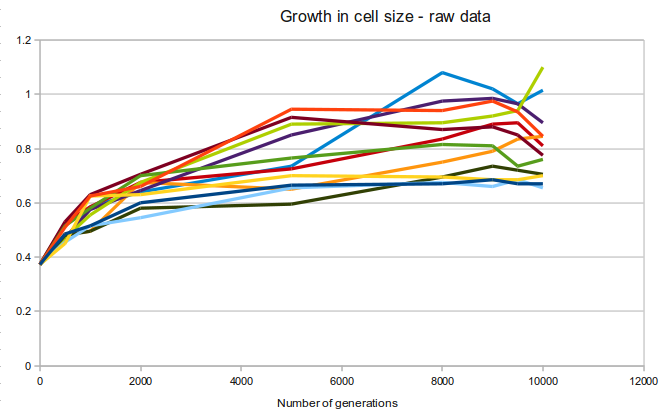
http://evolutionguide.wordpress.com/2011/11/10/the-best-of-the-lessons-of-evolution-the-longterm-e-coli-evolution-experiment/
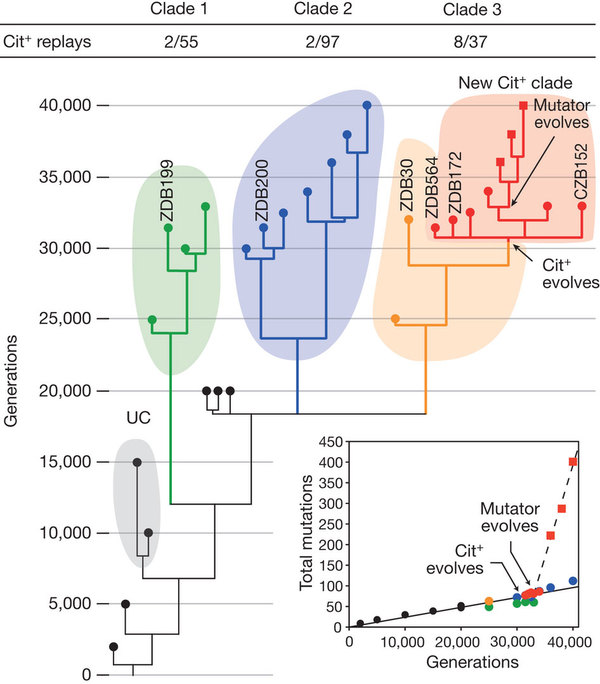
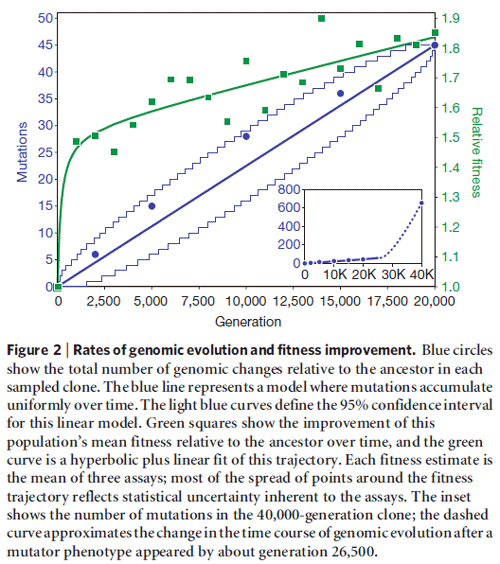
http://www.nature.com/nature/journal/v489/n7417/full/nature11514.html
http://blogs.discovermagazine.com/gnxp/2009/10/the-arc-of-evolutionary-genetics-is-long/#.UkBbn9Jwpft

http://evolutionguide.wordpress.com/2011/11/10/the-best-of-the-lessons-of-evolution-the-longterm-e-coli-evolution-experiment/

http://wps.prenhall.com/wps/media/objects/829/848975/EvoDotsTutorial.pdf
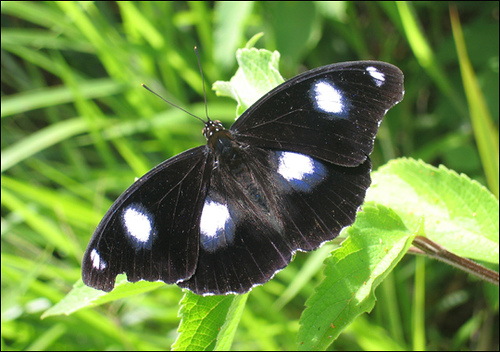
http://scienceblogs.com/grrlscientist/2007/07/16/samoan-butterflies-evolve-rapi/
Also:
http://www.livescience.com/1685-evolution-occurs-blink-eye.html
http://www.sciencemag.org/content/317/5835/214.full.pdf
http://www.sciencemag.org/content/317/5835/214.abstract
Also:
http://www.livescience.com/1685-evolution-occurs-blink-eye.html
http://www.sciencemag.org/content/317/5835/214.full.pdf
http://www.sciencemag.org/content/317/5835/214.abstract
http://www.bio.utexas.edu/faculty/sjasper/bio212/histevolth.html
Also:
http://scholar.harvard.edu/pennings/pages/hiv-drug-resistance
Also:
http://scholar.harvard.edu/pennings/pages/hiv-drug-resistance
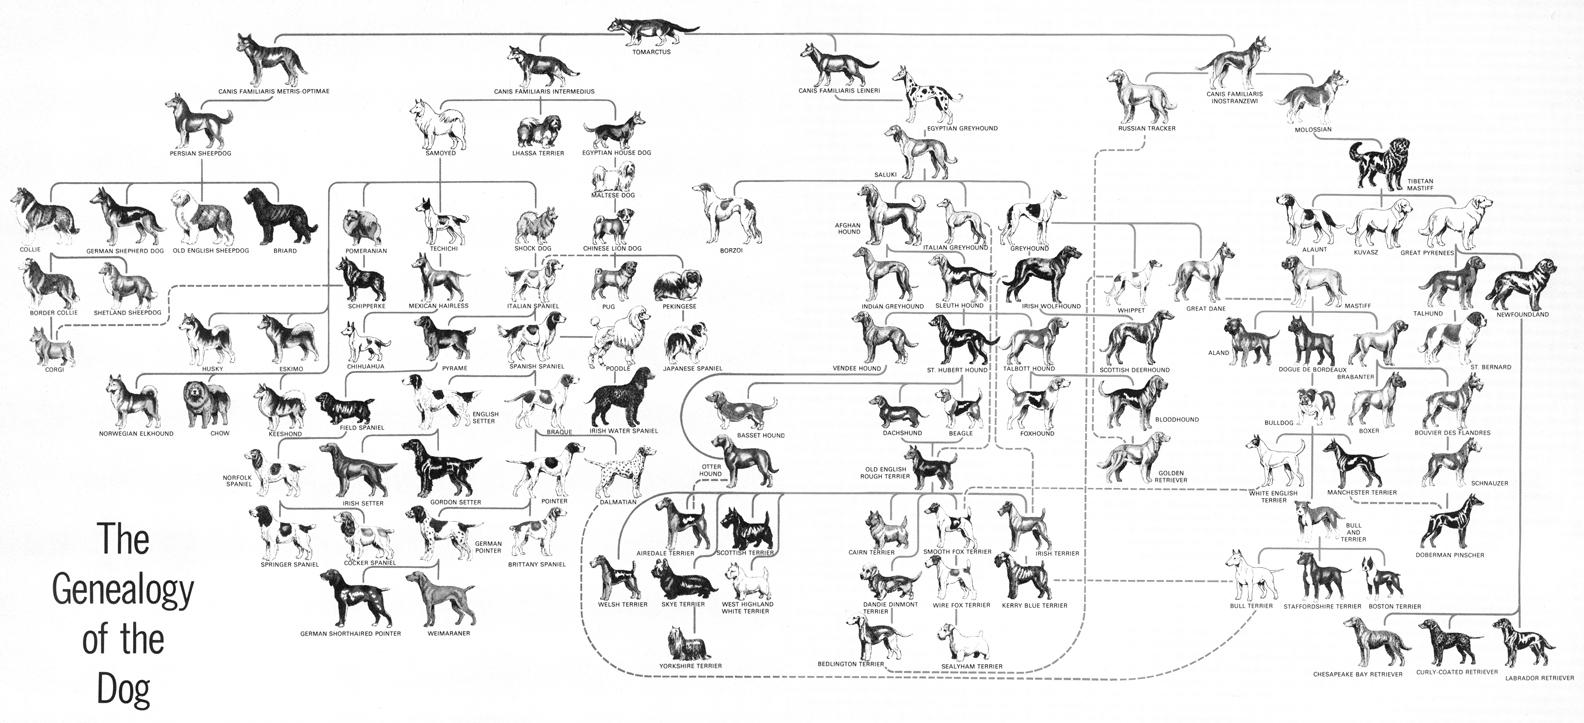
http://www.macwebguru.com/2010/09/11/the-dog/
http://annwyn.info/wolf/wolf23.html
http://evolution.berkeley.edu/evosite/evo101/IIIE4Evochange.shtml
http://faculty.uca.edu/johnc/introdarwin.htm
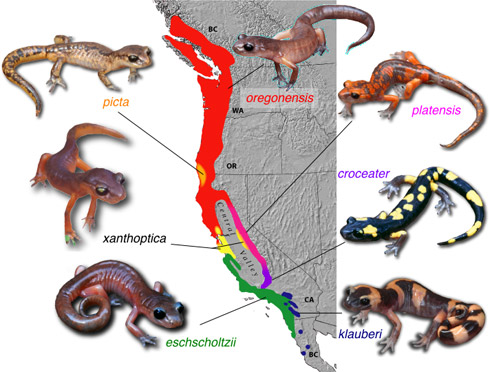
http://evolution.berkeley.edu/evolibrary/article/0_0_0/devitt_02

http://mappingignorance.org/2013/06/13/speciation-beyond-sexuality-critiques-to-the-biological-species-concept/
Updated genetics:
http://www.sciencedaily.com/releases/2014/05/140525154742.htm
The Larus Gulls of the Northern
Hemisphere: Notice the darkening of the feathers in a clockwise
direction starting at the bottom. Gull species near each other can
interbreed, except between the Herring Gull and the Lesser Black-Backed
Gull that diverged from each other long the longest ago. This inability
to breed tells the story of how the species likely spread overtime
around the world and met back up, now no longer able to interbreed.

http://darwiniana.org/zimmergulls.htm

When
species are in a particular location for a long time, genetic diversity
tends to go up as new mutations are added to the population. When
species migrate into new territories, genetic diversity tends to be low
because those new areas are populated by a few individuals. One way of
reading this diagram is a time scale. The more genetic diversity in an
area, the longer humans have lived there. Darwin knew this and
speculated that humans originated in Africa, since most great apes are
native
there.http://whyevolutionistrue.wordpress.com/2011/04/16/where-on-earth-did-language-begin/
Fonte: http://www.evolutionevidence.org/evidence/progressions/
Fonte: http://www.evolutionevidence.org/evidence/progressions/