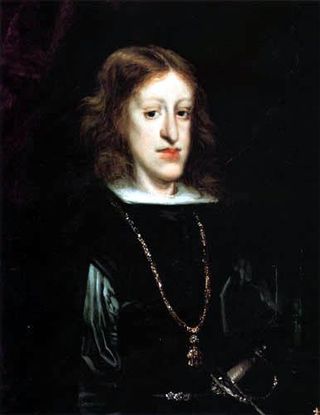
Muitos dos reis e rainhas da dinastia espanhola dos Habsburgos, que
governaram a Europa entre 16 e início do século 18, tinham uma
deformidade facial distinta: uma mandíbula alongada que mais tarde ficou
conhecida como a "mandíbula Habsburgo". Agora, um novo estudo sugere que essa característica facial provavelmente foi o resultado de séculos de consanguinidade.
"A dinastia Habsburgo foi uma das mais influentes da Europa", disse o
autor principal Roman Vilas, professor de genética da Universidade de
Santiago de Compostela, em comunicado . Mas a dinastia "ficou famosa pela consanguinidade, que foi sua eventual queda".
Isso ocorre porque a linhagem real da filial espanhola da dinastia
terminou em 1700 com a morte do rei Carlos II, que não conseguiu
produzir um herdeiro, provavelmente como resultado de endogamia, de
acordo com um relatório anterior da Live Science . Mas não estava claro se a tendência à consanguinidade também estava escrita em seus rostos.
Para descobrir se a mandíbula distintiva era resultado de
consanguinidade, Vilas e sua equipe encontraram 10 cirurgiões
maxilofaciais e pediram que analisassem 66 retratos de 15 membros da
dinastia Habsburgo. Os cirurgiões procuraram 11 características que definiam "prognatismo mandibular" ou protrusão do osso maxilar.
Eles também procuraram sete características que definem "deficiência
maxilar", uma condição relacionada na qual os ossos maxilares - ou os
ossos que formam a mandíbula superior - não se desenvolvem
completamente.
Os autores levantaram a hipótese - e mais tarde confirmaram - que essas
duas condições estavam relacionadas, tinham a mesma base genética e
constituíam a mandíbula dos Habsburgos, segundo o comunicado. Foi solicitado aos cirurgiões que pontuassem o grau de ambas as deformidades faciais para cada membro da dinastia Habsburgo.
Eles descobriram que Maria da Borgonha, que se casou com a família em
1477 e era duquesa da Borgonha, tinha o menor prognatismo mandibular,
enquanto Filipe IV, que governou a Espanha e Portugal de 1621 a 1640, o
mais.
Os cinco membros da dinastia real que têm a maior deficiência maxilar
foram Maximiliano I, que iniciou seu governo como Sacro Imperador Romano
em 1493; Filha de Maximilian; seu sobrinho; bisneto de seu sobrinho; e Carlos II, que foi o último da linha Habsburg.
Os autores calcularam a quantidade de consanguinidade que ocorreu ao
longo dos séculos, usando informações de uma grande árvore genealógica
que incluía 6.000 pessoas em 20 gerações.
Eles então correlacionaram a endogamia com o grau de deformidade facial
observado nas pinturas e descobriram que havia uma forte ligação entre o
grau de endogamia e o grau de prognatismo mandibular. Em outras palavras, as pessoas mais endogâmicas tiveram o caso mais pronunciado dessa deformidade facial.
Eles também descobriram que mais consanguinidade estava ligada a um
maior grau de deficiência maxilar, mas apenas em dois dos sete aspectos
diagnosticados.
Os endogamia provavelmente levaram à mandíbula de Habsburgo por causa
do que é chamado de homozigose genética - ou a herança da mesma forma de
um gene de ambos os pais, sugerem os autores.
A homozigose genética ocorre mais frequentemente quando os parentes se
acasalam, porque compartilham uma proporção maior de genes.
Dito isto, o estudo é pequeno e, portanto, não é possível dizer que a
mandíbula dos Habsburgos seja definitivamente causada por
consanguinidade, segundo os pesquisadores. Os resultados foram publicados hoje (2 de dezembro) na revista Annals of Human Biology .
A poderosa dinastia Habsburgo que governou a Espanha por quase 200 anos
chegou a um fim abrupto em 1700 com a morte do rei Carlos II, que não
deixou herdeiros no trono. O término dessa linhagem real pode ser o resultado de consanguinidade frequente da linhagem, que pode ter deixado Carlos II doente e infértil, sugere um novo estudo. A Casa de Habsburgofoi uma das principais casas reais da Europa por muitos séculos.
Os Habsburgos governaram a Áustria por mais de seis séculos, chegando a
governar (através de casamentos) a Boêmia, a Hungria e a Espanha. A dinastia espanhola dos Habsburgos foi fundada por Filipe I (ou Filipe, o Fair, filho do Sacro Imperador Romano
Maximiliano I) em 1516, quando se casou com Joanna, a Louca, filha dos
governantes católicos espanhóis Ferdinand de Aragon e Elizabeth de
Castile. A casa dominava a Espanha em toda a sua influência e império.
Porém, dados históricos mostram que "para manter sua herança em suas
próprias mãos, os Habsburgos espanhóis começaram a se casar cada vez
mais frequentemente entre si", escreveram os autores do novo estudo. Os registros mostram que os reis Habsburgos espanhóis frequentemente se
envolviam em casamento consanguíneo (ou casamento entre parentes
biológicos);
nove dos 11 casamentos ocorridos durante o reinado de 200 anos da
dinastia eram consanguíneos, com dois casamentos de tio sobrinha e um
casamento de primo em primeiro grau. Foi sugerido que esse alto grau de endogamia levou à eventual extinção
da linhagem quando o "deficiente físico, mental e mentalmente
desfigurado" Charles II morreu após dois casamentos sem filhos,
escreveram os autores. Mas essa ideia nunca havia sido examinada de uma perspectiva genética.
Gonzalo Alvarez e seus colegas da Universidade de Santiago de
Compostela, na Espanha, calcularam o que é chamado de coeficiente de
endogamia para cada indivíduo em 16 gerações dos Habsburgos, usando
informações genealógicas de Carlos II e 3.000 de seus parentes e
ancestrais. O coeficiente de endogamia indica a probabilidade de um indivíduo receber dois genes idênticos em uma determinada posição em um cromossomo por causa da relação de seus pais. Evidência de consanguinidade
A equipe de Alvarez descobriu que o coeficiente de consanguinidade
aumentou consideravelmente ao longo das gerações, de 0,025 para Filipe I
a 0,254 para Carlos II - quase tão alto quanto seria esperado para os
filhos de um casamento incestuoso (pai-filho ou irmão-irmã). Carlos II, que foi apelidado de El Hechizado ("The Hexed"), foi o
produto de um casamento de tio-sobrinha - Phillip IV com sua sobrinha
Mariana da Áustria. Seu avô Filipe III também nasceu de um casamento de tio-sobrinha - Filipe II com sua sobrinha Anna da Áustria. O alto grau de parentesco dos pais desses governantes combinado com a
consanguinidade remota na linhagem provavelmente teve um impacto
significativo na eventual extinção da linhagem. Outra evidência que sustenta essa conclusão é a forte taxa de mortalidade infantil nas famílias Habsburgo.
Apenas cerca de 60% das crianças sobreviveram até os 1 anos de idade e
apenas metade das crianças nascidas na dinastia sobreviveu aos 10 anos,
em comparação com a sobrevivência de cerca de 80% das crianças nas
aldeias espanholas da época. Os distúrbios e doenças de Carlos II também são evidências da consanguinidade da linhagem.
Segundo os escritos contemporâneos, ele era baixo e fraco e sofria de
problemas intestinais e hematúria esporádica (presença de glóbulos
vermelhos na urina).Ele não falou até os 4 anos de idade e não andou até os 8 anos de idade.
Tais efeitos prejudiciais à saúde são frequentemente vistos em filhos
de casamento consanguíneo, porque são mais propensos a herdar raras
versões deletérias e recessivas dos genes.
Com base nas informações históricas que coletaram e no conhecimento
genético clínico, Alvarez e seu colega determinaram que as doenças e
impotência / infertilidade de Charles II (reclamadas por seus cônjuges)
são o resultado de dois distúrbios genéticos
- deficiência combinada de hormônio hipofisário e acidose tubular renal
distal ( uma condição que causa acúmulo de ácido no organismo, porque
os rins não o canalizam adequadamente na urina).
Com a morte de Carlos II (aos 39 anos) e o fim da linha dos Habsburgos
espanhóis, a Casa de Bourbon da França assumiu a coroa espanhola. As conclusões do estudo estão detalhadas em 14 de abril na revista online Public Library of Science ONE .
O coala, a única espécie existente da família marsupial Phascolarctidae, é classificado como "vulnerável" devido à perda de habitat e doença generalizada. Sequenciamos o genoma do coala, produzindo um genoma de referência marsupial completo e contíguo, incluindo os centrômeros. Revelamos que a capacidade do coala de desintoxicar a folhagem do eucalipto pode ser devida a expansões dentro de uma família de genes do citocromo P450, e sua capacidade de cheirar, saborear e moderar a ingestão de metabólitos secundários de plantas pode ser devida a expansões nos receptores vomeronasais e gustativos. Nós caracterizamos novas proteínas de lactação que protegem jovens na bolsa e anotamos genes imunes importantes para a resposta à doença de clamídia. A demografia histórica mostrou uma queda substancial na população, coincidente com o declínio da megafauna australiana, enquanto as populações contemporâneas tinham fronteiras biogeográficas e aumentavam a endogamia em populações afetadas por translocações históricas. Identificamos populações geneticamente diversas que exigem corredores de habitat e instituir programas de translocação para ajudar na sobrevivência do koala na natureza.
Main
O koala é um marsupial australiano icônico, instantaneamente reconhecível por seu rosto humanóide redondo e forma de corpo distinta. Evidências fósseis identificam até 15-20 espécies, seguindo a divergência de coalas (Phascolarctidae) de terrestres wombats (Vombatidae) 30-40 milhões de anos atrás1,2 (Figura 1 Complementar). O moderno coala, Phascolarctos cinereus, que apareceu pela primeira vez no registro fóssil há 350 mil anos, é a única espécie existente dos Phascolarctidae.
Como outros marsupiais, os coalas dão à luz jovens subdesenvolvidos. O nascimento ocorre após apenas 35 dias de gestação, com jovens sem tecidos ou órgãos imunológicos. Seu sistema imunológico se desenvolve enquanto eles estão na bolsa, o que significa que a sobrevivência no início da vida depende da proteção imunológica fornecida pelo leite materno.
Um folíolo arbóreo especialista que se alimenta quase exclusivamente de Eucalyptus spp., O coala possui uma dieta que seria tóxica ou fatal para a maioria dos outros mamíferos3. Devido ao baixo teor calórico desta dieta, o coala descansa e dorme até 22 h por dia4. Uma compreensão detalhada dos mecanismos pelos quais os coalas desintoxicam o eucalipto e protegem seus filhotes na bolsa tem sido elusiva, já que não existem colônias de pesquisa de coalas e o acesso a amostras de leite e tecidos é oportunista. O genoma permite insights sem precedentes sobre a biologia única do coala, sem ter que prejudicar ou perturbar um animal de preocupação com a conservação.
O genoma também permite uma abordagem holística e cientificamente fundamentada para a conservação do coala. A Austrália tem o maior registro de extinção de mamíferos de todos os países durante o Antropoceno5, e os números de coalas despencaram em partes do norte desde a colonização européia do continente6, mas aumentaram em trechos sul da cordilheira, notavelmente em partes de Victoria e Austrália Meridional. A resposta desigual das populações de coalas em toda a sua extensão é uma das questões mais difíceis em sua gestão7.
A espécie foi fortemente explorada por um comércio de peles (de 1870 até o final da década de 1920), que colheu milhões de animais6,8,9. Hoje, as ameaças são principalmente devido à perda e fragmentação do habitat, urbanização, mudanças climáticas e doenças. As estimativas atuais colocam o número de coalas na Austrália em apenas 329.000 (entre 144.000 e 605.000), e um declínio contínuo é previsto6. As coalas apresentam um complexo enigma da conservação: no norte, as causas do declínio incluem a fragmentação do habitat, a urbanização e a doença. No entanto, o declínio no sul seguiu uma trajetória diferente10, com translocações difundidas, muitas vezes sequenciais (1920-1990) de uma população fundadora limitada, o que resultou em populações geneticamente bloqueadas que são superabundantes a ponto de passar fome em algumas áreas11. Existem diferenças marcantes no grau em que as ameaças afetam cada população, alertando, assim, contra uma prescrição para a recuperação da população.
Somando-se à complexidade da conservação do coala está o impacto da doença, especificamente o retrovírus koala (KoRV) e a clamídia. Acredita-se que o KoRV tenha chegado à Austrália através de um vetor putativo de murinos antes da transmissão entre espécies12,13. Atualmente, é predominante nos coalas do norte e parece estar se espalhando para as populações do sul14. Algumas cepas parecem ser mais virulentas que outras e estão supostamente associadas a um aumento na doença neoplásica15. Da mesma forma, a clamídia, que em alguns indivíduos causa sintomas graves, mas em outros permanece assintomática, pode ter cruzado a barreira de espécies de hospedeiros introduzidos, como ovelhas domésticas e bovinos, após a colonização europeia16. Um genoma completo do coala oferece insights sobre a suscetibilidade genética dessas espécies, fornece a base genômica para vacinas inovadoras e pode sustentar novas soluções de manejo conservacionista que incorporam a população e a estrutura genética da espécie, como facilitar o fluxo gênico via conectividade de habitat ou translocações.
Results
Genome landscape
Coalas têm 16 cromossomos, diferindo do marsupial ancestral 2n = 14 cariótipo por uma fissão simples do cromossomo ancestral 2 dando origem aos cromossomos 4 e 717 do coala. Nós sequenciamos o genoma completo usando 57,3 vezes a cobertura de leitura longa do PacBio, gerando 3,42 Gb conjunto de referência. Os contigs primários do conjunto FALCON (representando regiões homozigóticas do genoma) produziram a versão do genoma phaCin_unsw_v4.1. Isso compreendeu 3,19 Gb, incluindo 1.906 contigs com uma N50 de 11,6 Mb e a maior com 40,6 Mb.
As regiões heterozigóticas do genoma (representando os contigs alternativos da montagem) totalizaram 230 Mb, com um N50 de 48,8 kb (Tabela 1, Tabelas Suplementares 1-3 e Métodos). Aproximadamente 30 vezes a cobertura das leituras curtas da Illumina foi usada para polir a montagem. Mapas ópticos BioNano e informações adicionais de sintenia conservada para marsupiais foram usados em andaimes18 para montar contigs de leitura longa em scaffolds cromossômicos "virtuais" (‘super-contigs’) (Tabelas Suplementares 4 e 5 e Nota Suplementar). O maior super-contágio abrangeu aproximadamente metade do cromossomo koala 7 (Supplementary Fig. 2).
Table
1 Comparison of assembly quality between koala genome assembly
phaCin_unsw_v4.1 and published marsupial and monotreme genomes
Nossa sequência de longa leitura apresentou a oportunidade de identificar e estudar os centrômeros, que são regiões de múltiplas megabases que são difíceis de construir em conjuntos de genoma eutérios (por exemplo, humanos e camundongos) devido a arranjos intratáveis de ordem superior de satélites.
Os centrômeros são menores nos marsupiais do que nos eutérios, e, como tal, são mais passíveis de análise20. A imunoprecipitação e o sequenciamento da cromatina utilizando anticorpos para proteínas centroméricas (CENP-A e CREST) 21 permitiram a identificação de scaffolds contendo regiões centroméricas putativas (Figura 3 Suplementar) e a caracterização de repetições conhecidas e novas, incluindo elementos compostos em domínios centrômicos de koala (Supplementary Tabela 6–10) que não possuem o retroelemento previamente anotado, o retrovírus canguru endógeno (KERV), encontrado em alguns centrômeros wallabys tammar22.
Centromeres de coalas abrangem um total de 2,6 Mb do genoma haplóide do coala, equivalente a uma média de 300 kb de material centromérico por cromossomo. Como os de outras espécies com pequenos centrômeros19,20,23,24, os centrômeros de coala não possuem matrizes de satélite de ordem superior (Tabelas Suplementares 7-10). Entre as repetições recentemente identificadas, algumas são similares a elementos compostos recentemente descritos em centrómetros de gibões25, onde a ausência de arranjos satélites de ordem superior acompanhou a evolução de novos elementos compostos com suposta função de centrômero. A composição do centrômero koala, portanto, suporta evidências crescentes de que os elementos transponíveis representam um componente principal e funcional de pequenos centrômeros quando as matrizes satélites de ordem mais alta estão ausentes20,24,25.
Interspersed
repeats account for approximately 47.5% of the koala genome; 44% of
these are transposable elements (Supplementary Table 11).
As in other mammalian genomes, short interspersed nuclear elements
(SINEs) and long interspersed nuclear elements (LINEs) are the most
numerous elements (35.2% and 28.9% of total number of elements,
respectively), with LINEs making up 32.1% of the koala genome. The
long-read sequence assembly also enabled full characterization and
annotation of repeat-rich long noncoding RNAs, including RSX, which mediates X chromosome inactivation in female marsupials26. Koala RSX represents the first marsupial RSX to be fully annotated and to have its structure predicted (Supplementary Fig. 4 and Supplementary Note). As expected, it was expressed in all female tissues, but in no male tissues27.
The
assembled koala genome has very high coverage of coding regions: we
recovered 95.1% of 4,104 mammalian benchmarking universal single-copy
orthologs (BUSCOs)28, the highest value for any published marsupial genome (Supplementary Table 5)
and comparable with that of the human assembly (GRCh38, which scores
94.1% of orthologs). Analysis of gene family evolution using a
maximum-likelihood framework identified 6,124 protein-coding genes in
2,118 gene families with at least two members in koala. Among these,
1,089 have more gene members in koala than in any of the other species
(human, mouse, dog, tammar wallaby, Tasmanian devil, gray short-tailed
opossum, platypus, chicken; Supplementary Fig. 5).
Having
characterized the genome, we undertook detailed analyses of key genes
and gene families to gain insights into the genomic basis of the koala’s
highly specialized biology. Gene families of particular interest were
those that encode proteins involved in induced ovulation, those proteins
involved in the complex lactation process, those proteins responsible
for immunity, and those enzymes that enable the koala to subsist on a
toxic diet.
Capacidade de tolerar uma dieta altamente tóxica
A dieta de folhas de eucalipto do koala contém altos níveis de metabólitos secundários de plantas29, compostos fenólicos30 e terpenos (por exemplo, ref. 31) que seriam letais para a maioria dos outros mamíferos32. Portanto, os coalas experimentam pouca competição por recursos alimentares. Eucalyptus grandis apresenta expansão substancial nos genes da terpeno sintase em relação a outros genomas de plantas33. Portanto, é provável que a toxicidade do eucalipto tenha exercido pressão de seleção sobre a capacidade do coala de metabolizar esses xenobióticos, de modo que procuramos genes que codificam enzimas com uma função de desintoxicação e investigamos a evolução da seqüência nesses loci.
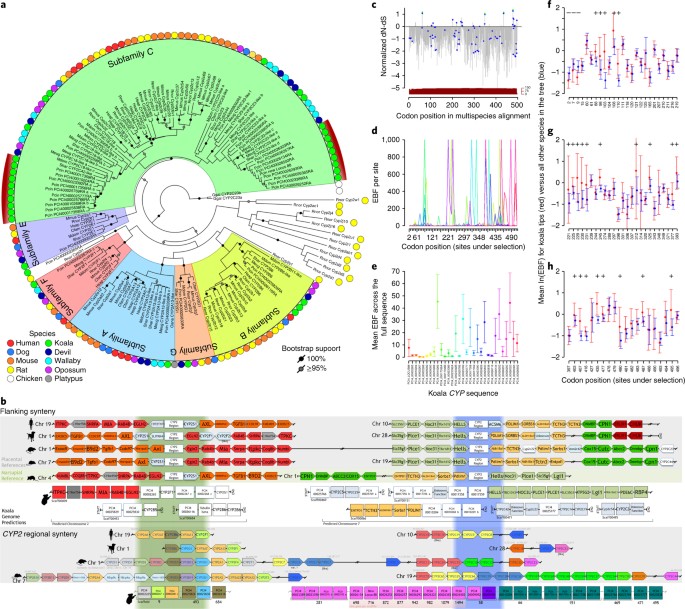
Os genes da monoxigenase do citocromo P450 (CYP) representam uma superfamília multigênica de enzimas heme-tiolato que desempenham um papel na desintoxicação através do metabolismo oxidativo da fase 1 de uma variedade de compostos, incluindo xenobióticos34. Esses genes foram identificados em toda a árvore da vida, inclusive em plantas, animais, fungos, bactérias e vírus35. No genoma do coala encontramos duas expansões monofiléticas específicas da linhagem da subfamília C do citocromo P450 2 (CYP2Cs, 31 membros em koala) (Fig. 1a). A importância funcional destes genes CYP2C foi ainda demonstrada através da análise da expressão em 15 transcriptomas de koala de dois coalas, mostrando uma expressão particularmente elevada no fígado, consistente com um papel na desintoxicação.
(Supplementary Fig. 6).
Fig. 1: Analysis of cytochrome P450 family 2 subfamily C gene family.
a, Phylogenetic tree of CYP2 gene family in koala (Pcin; 31 CYP2
members), compared with marsupials: tammar wallaby (Meug), Tasmanian
devil (Shar), gray short-tailed opossum (Mdom); eutherian mammals: human
(Hsap), rat (Rnor), mouse (Mmus), dog (Cfam); monotreme: platypus
(Oana); and outgroup chicken (Ggal). Two independent monophyletic
expansions are seen in koala in the CYP2C subfamily (highlighted by red arcs). b, CYP synteny map showing expansion of CYP2C genes in koala as compared to eutherians (human, dog, rat, mouse) and another marsupial (opossum). c–h, Selection analysis of CYP gene expansion. c, Normalized dN-dS (SLAC (single-likelihood ancestor counting) method) across the alignment of 152 CYP
sequences (only sites with data in koala and at least one other
species; red bars show sequence depth). Points indicate statistically
significant (threshold α = 0.1) evidence for codons under selection.
Four sites show positive selection across entire tree (SLAC; green
points); 70 sites show episodic selection (MEME (mixed effects model of
evolution); blue diamonds). d, Comparison of episodic selection on particular codons across koala CYP genes (n = 31); x axis shows codons with evidence of statistically significant selection anywhere on the tree (identified in c). e, Comparison of mean episodic selection among koala CYP genes (n = 70).
Points indicate mean empirical Bayes factor (EBF) for sites under
selection for each sequence; error bars, 95% confidence interval. f–h, Mean EBF (natural log transformed, EBF values of 0 excluded) for koala tree tips (n = 31; red) relative to all others (n = 121 in 9 species (see Methods),
blue). Points show mean, error bars ± 95% confidence interval,
evaluated as 1.96 × s.e.m. (using sequence depth as sample size; red
bars in c). Codon positions on x axis refer to multispecies alignment from c.
Symbols above each point indicate that the mean value for koala site
falls outside the 95% confidence interval for all other species (above,
“ + ”; below, “–”; two-tailed test at α = 0.05). Raw statistics shown
(unadjusted for multiple comparisons).
Comparing CYP2C gene context in mouse versus koala identified conserved flanking markers strongly suggestive of tandem duplication (Fig. 1b). Further sequence-level analysis of the CYP expansions indicated that most conserved regions are under strong purifying selection (Fig. 1c). However, there is evidence that individual CYP codons have experienced episodic diversifying selection while purifying selection shapes the rest of the gene (Fig. 1c–h, Supplementary Note and Supplementary Tables 12 and 13). Adaptive expansion of CYP2C
and maintenance of duplicates appear to have worked in concert,
resulting in higher enzyme levels for detoxification while the interplay
between purifying and diversifying selection resulted in
neofunctionalization within the CYPs. Such adaptations enable koalas to detoxify their highly specialized diet rich in plant secondary metabolites.
The characterization of koala CYP2Cs has significant therapeutic potential. The high expression levels of CYP2C
genes in the liver helps to explain why meloxicam, a nonsteroidal
anti-inflammatory drug (NSAID) known to be metabolized by the protein
product of CYP2C in humans36,37
and frequently used for pain relief in veterinary care, is so rapidly
metabolized in the koala and a handful of other eucalypt-eating
marsupials (common brushtail possum and eastern ringtail possum)
compared with eutherian species37,38. It is expected that other NSAIDs are also rapidly metabolized in koalas and have little efficacy at suggested doses39.
Anti-chlamydia antibiotics such as chloramphenicol are degraded rapidly
by koalas; treatment with a single dose applicable to humans is
insufficient in koalas, which require a daily dose for up to 30 to 45 d.
This discovery of CYP2C gene expression levels will inform new research into the pharmacokinetics of medicines in koalas.
Taste, smell and food choice
Like
many specialist folivores, koalas are notoriously selective feeders,
making food choices both to target nutrients and to avoid plant
secondary metabolites40. Koalas have been observed to sniff leaves before tasting them41, and their acute discrimination has been correlated with the complexity and concentration of plant secondary metabolites42.
This suggests an important role for olfaction and vomerolfaction, as
well as taste. While most herbivores circumvent plant chemical defenses
by detoxifying one or a few compounds43,
the complexity of eucalyptus plant secondary metabolites, in
combination with the terpene expansion in eucalypts, led us to
hypothesize that the koala requires enhanced capabilities both in
specialist detection and in plant secondary metabolite detoxification.
We therefore investigated the genomic basis of the koala’s taste and
smell senses, finding multiple gene family expansions that could enhance
its ability to make food choices.
We report an expansion of one lineage of vomeronasal receptor type 1 (V1R) genes associated with the detection of nonvolatile odorants (Supplementary Note).
There are six such genes in koala, compared with only one in the
Tasmanian devil and gray short-tailed opossum, and none found in tammar
wallaby, human, mouse, dog, platypus or chicken. The expansion of one
lineage of V1R genes is consistent with the koala’s ability to discriminate among diverse plant secondary metabolites.
Surprisingly, given the degree of its dietary specialization, the olfactory receptor genes (n = 1,169)
characterized in koala had a gene repertoire that was slightly smaller
than that of gray short-tailed opossum (1,431 genes), tammar wallaby
(1,660 genes) and Tasmanian devil (1,279 genes) (Supplementary Note). This may be understood in the context of relaxed selection on olfactory receptors among dietary specialists44.
We
also report genomic evidence of expansions within the taste receptor
families that would enable the koala to optimize ingestion of leaves
with a higher moisture and nutrient content in concert with the
concentration of toxic plant secondary metabolites in their food plants.
The koala’s ability to ‘taste water’ is potentially enhanced by an
apparent functional duplication of the aquaporin 5 gene45,46,47 (Supplementary Table 14 and Supplementary Note).
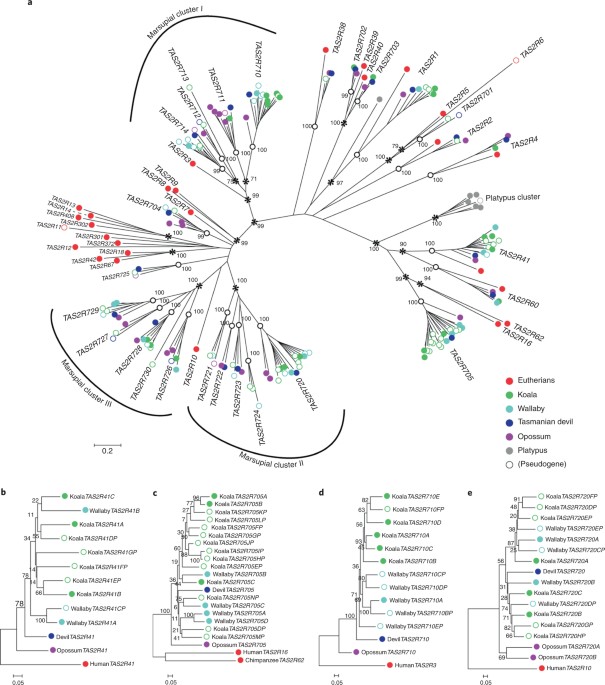
The TAS2R
family has a role in ‘bitter’ taste, enabling recognition of structural
toxins such as terpenes, phenols and glycosides. These are found in
various levels in eucalypts as plant secondary metabolites3,30,31,48. In marsupials, the TAS2R
family includes the orthologous repertoires from eutherians, as well as
three specific expansions in the last common ancestor shared by all
marsupials49,50 (Fig. 2). Large koala-specific duplications in four marsupial orthologous groups have produced a large koala TAS2R repertoire of 24 genes (Fig. 2). The koala has more TAS2Rs than any other Australian marsupial, and among the most of all mammal species49,50, including paralogs of human and mouse receptors whose agonists are toxic glycosides (Supplementary Table 15 and Supplementary Note). The TAS1R
gene families, responsible for sweet taste and umami amino acid
perception, have previously been reported as pseudogenized in eutherians
with highly specialized diets, such as the giant panda51. In the koala, however, we found that all TAS1R genes are putatively functional (Supplementary Fig. 7).
Fig.
2: Taste receptor analysis in koalas and other mammals identifies three
marsupial-specific expansions and further koala-specific duplications.
TAS2R genes are responsible for bitter taste perception. a, Maximum-likelihood tree of TAS2Rs (including pseudogenes) in the four marsupials, where the sequences contained 250 amino acids. 28 representative TAS2Rs of orthologous gene groups (OGGs) in eutherians (red circles) and 7 platypus TAS2Rs
(gray circles) were also used. There were 27 distinct marsupial OGGs
(supported by ≥99% bootstrap values), where the nodes of OGG clades are
indicated by white open circles. Bootstrap values of ≥70% in the nodes
connecting OGG clades are indicated by asterisks. There are three
marsupial-specific clusters (I, II and III) where massive expansion
events occurred in the common ancestor of marsupials after their split
from eutherian ancestors. b–e, Reconstructed maximum-likelihood trees of
TAS2R orthologs in which there are more than two duplicates of koala TAS2Rs: b, TAS2R41; c, TAS2R705; d, TAS2R710; and e, TAS2R720. Genomic structures of the umami and sweet taste receptor TAS1Rs were also analyzed and found to be functional in koala (see Supplementary Note).
Koala reproduction is of particular interest because the koala is an induced ovulator52, with key genes controlling female ovulation (LHB, FSHB, ERR1, ERR2), as well as prostaglandin synthesis genes important in parturition and ejaculation (PTGS1, PTGS2, PTGS3) (Supplementary Note). We identified genes putatively involved in the induction of ovulation in the female by male seminal plasma (NGF), and in coagulation of seminal fluid (ODC1, SAT1, SAT2, SMOX, SRM, SMS) (Supplementary Note), which may function to prevent sperm leakage from the female reproductive tract in this arboreal species.
Genomic characterization of koala milk
A
koala young is about the size of a kidney bean and weighs < 0.5 g.
It crawls into the mother’s posteriorly opening pouch and attaches to a
teat, where it remains for 6–7 months. It continues to suck after it has
left the pouch until about a year old.
Analysis of the genome, in
conjunction with a mammary transcriptome and a milk proteome, enabled
us to characterize the main components of koala milk (Supplementary Fig.
8, Supplementary Table 16, Supplementary Note and ref. 53).
The high-quality assembly of the genome allowed both the identification
of marsupial-specific genes and determination of their evolutionary
origins based on their genomic locations. For instance, we found that
there are four Late Lactation Protein (LLP) genes tightly linked to both trichosurin and β-lactoglobulin (Supplementary Fig. 8),
potentially allowing marsupials to fine-tune milk protein composition
across the stages of lactation to meet the changing needs of their
young. Additionally, the koala marsupial milk 1 (MM1) gene, a novel marsupial gene, is located close to the gene encoding very early lactation protein (VELP), an ortholog of Glycam1 (or PP3) that encodes a eutherian antimicrobial protein53 (Supplementary Fig. 8).
In eutherians, this region contains an array of short glycoproteins
that have antimicrobial properties and are found in secretions such as
milk, tears and sweat. We propose that MM1 has an antimicrobial
role in marsupial milk, along with three other short novel genes located
in the same region. We also detected expansions in another
antimicrobial gene family, the cathelicidins.
Koala immunome and disease
At
the time of European settlement, koalas were widespread in eastern
mainland Australia, from north Queensland to the southeastern corner of
South Australia. Today they are mainly confined to the east coast and
are listed as ‘vulnerable’ under Australia’s Environment Protection and Biodiversity Conservation Act 199954.
There is strong evidence to suggest that some fragmented populations of
koalas are already facing extinction, particularly in formerly densely
populated koala territories in southeast Queensland and northern New
South Wales. A major challenge for the conservation of these declining
koala populations is the high prevalence of disease, especially that
caused by the obligate intracellular bacterial pathogen Chlamydia pecorum, which is found across the geographic range, with the exception of some offshore islands55.
A main challenge for managing these populations has been the lack of
knowledge about the koala immune response to disease. Recent modeling
suggests the best way to stabilize heavily affected koala populations is
to target disease56.
The
long-read-based genome enabled the de novo assembly of complex, highly
duplicated immune gene families and comprehensive annotation of immune
gene clusters53,57,58. These include the major histocompatibility complex (MHC)59, as well as T cell receptors (TCR), immunoglobulin (IG) (Supplementary Fig. 9, Supplementary Tables 17 and 18, and Supplementary Note), natural killer cell (NK) receptor58 and defensin60
gene clusters. Together these findings provide a starting point for new
disease research and allow us to interrogate the immune response to the
most significant pathogen of the koala, C. pecorum.
Of the
more than 1,000 koalas arriving annually at wildlife hospitals in
Queensland and New South Wales, 40% have late-stage chlamydial disease
and cannot be rehabilitated. Annotation of koala immune genes enabled us
to study variation within candidate genes known to play a role in
resistance and susceptibility to chlamydia infection in other species
(Supplementary Tables 18–20). Preliminary case/control association tests for five koalas involved in a chlamydia vaccination trial showed that the MHCII DMA and DMB genes, as well as the CD8-a gene, may be involved in differential immune responses to chlamydia vaccine (Supplementary Table 21 and Supplementary Note).
We also conducted differential expression analysis of RNA sequencing
(RNA-seq) data from conjunctival tissue collected from koalas at
necropsy, both with and without signs of ocular chlamydiosis, showing
that in diseased animals, 1,508 of the 26,558 annotated genes (5.7%)
were twofold upregulated, while 685 (2.6%) were downregulated by greater
than twofold when compared with healthy animals (Supplementary Fig. 9 and Supplementary Note).
In diseased animals, upregulated genes were associated with Gene
Ontology (GO) terms for a range of immunological processes, including
signatures of leukocyte infiltration (Supplementary Fig. 9). Immune responses in the affected conjunctivas were directed at TH1 rather than TH2 responses. Proinflammatory mediators such as CCL20, IL1α, IL1β, IL6 and SSA1
were also upregulated. As in human trachoma, this cascade of
proinflammatory products may help to clear the infection but may also
lead to tissue damage in the host61. Furthermore, resolution of human trachoma infection is thought to require a IFN-γ driven TH1 response62,
and in diseased koalas we found that IFN-γ was upregulated 4.7-fold in
the conjunctival tissue. These annotated koala immune genes will now
help us to define features of protective versus pathogenic immunological
responses to the disease and may be invaluable for effective vaccine
design.
Koala genomes are undergoing genomic invasion by koala retrovirus (KoRV)63,
which is spreading from the north of the country to the south. Both
endogenous (germline transmission) and exogenous (infectious
‘horizontal’ transmission) forms are extant64.
Our results provide a comprehensive view of KoRV insertions in the
koala genome. We found a total of 73 insertions in the phaCin_unsw_4.1
assembly (Supplementary Table 22).
It is likely that most of these 73 loci are endogenous, consistent with
our observation of integration breakpoint sequences that are shared
with one or both of the other koala genomes reported (Supplementary
Tables 23 and 24).
We
investigated the sites of KoRV insertion to define their proximity to
protein-coding genes and explore possible disruptions. This analysis
identified insertions into 24 protein-coding genes (Supplementary Table 25).
However, none is likely to disrupt protein-coding capacity, since 22
insertions are in introns and the other two are in 3′ untranslated
regions. Transcription proceeding from the proviral long terminal repeat
(LTR) could possibly affect the transcription of the host genes.
Understanding
the genetics of host resistance to chlamydia and the etiology of the
retrovirus will help inform the development of vaccines against both
diseases, as well as translocation strategies.
Genome-informed conservation
Broad-scale
population management of koalas is critical to conservation efforts.
This is challenging because distribution models are not easily
generalized across bioregions, and further complicated by the unique
regional conservation issues described above. Since it is not possible
to generalize management, it is imperative that decisions are informed
by empirical data relevant to each bioregion.
Analysis of the
koala genome provided the unique opportunity to combine historical
evolutionary data with high-resolution contemporary population genomic
markers to address these management challenges. To infer the ancient
demographic history of the species, we analyzed the long-read reference
genome and short-read data from two other koalas, using the pairwise
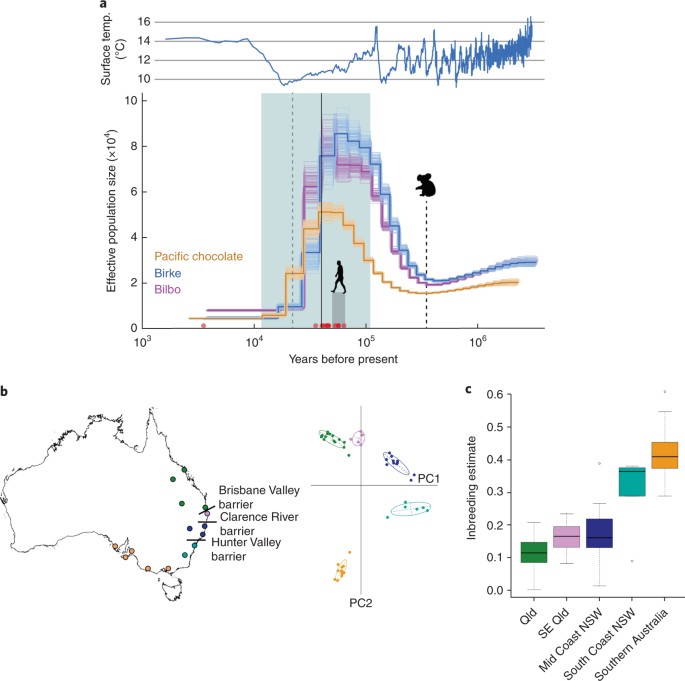
sequentially Markovian coalescent (PSMC) method65 (Fig. 3a, Supplementary Fig. 10 and Methods). The data show that the modern koala, which appeared in the fossil record 350,000 years ago2,
underwent an initial increase in population, followed by a rapid and
widespread decrease in population size ~30,000–40,000 years ago. This is
consistent with fossil evidence of rapid declines in multiple
Australian species, including the extinct megafauna, 40,000–50,000 years
ago66 and 30,000–40,000 years ago67. The koala was thus one of a number of species affected by decline during this time that did not ultimately become extinct67.
Fig. 3: Analysis koala populations using genome-mapped markers.
a, Top: plot of surface temperature (temp.) over past 3 million years based on a five-point running mean of δ18O data76.
Bottom: population demographic history inferred from diploid sequences
of three koalas (females ‘Pacific Chocolate’ and ‘Bilbo’, male ‘Birke’)
using the pairwise sequential Markovian coalescent (PSMC) method. Koala
silhouette indicates earliest fossil record of modern koala2. Gray shading, human arrival in Australia77 (see ref. 78); red circles, estimated extinction times of 16 megafaunal genera in mainland Australia79;
aqua area, last glacial period; vertical dashed green line, last
glacial maximum; vertical solid black line, first koala population
declines 40,000 years ago. Dark colored lines are estimated from genome
data; lighter lines, plots inferred from 100 bootstrap replicates. A
mutation rate of 1.45 × 10⁻⁸ mutations per site per generation and 7-year generation time were assumed. b,
Right, principal component (PC) analysis (including 95% inertia
ellipses) of 1,200 SNPs in 49 wild koalas from throughout Australia.
Left, geographic clustering of wild koalas in eastern Australia in
relation to proposed biogeographic barriers68,72,
highlighting known historic barriers to gene flow, the Brisbane and
Clarence River Valleys, but also suggesting a role for the Hunter
Valley. The cluster of genetically similar southern koalas reflects a
recent history of widespread translocation8. c, Average inbreeding coefficient (F) (calculated by TrioML80,81) of 49 wild koalas. Qld, Queensland; SE, southeast; NSW, New South Wales. P values arising from linear modeling represent significant differences in mean F between regions (***P < 0.001; **P < 0.01). There is a high correlation between geographic distance and genetic distance (Mantel test: r2 = 0.4898),
indicating that genetic rescue between populations is feasible. Center
lines, median; box limits, upper and lower quartiles. Upper
whisker = min(max(x), Q_3 + 1.5 × IQR), lower whisker = max(min(x),
Q_1 – 1.5 × IQR); i.e., upper whisker = upper quartile + 1.5 × box
length, lower whisker = lower quartile – 1.5 × box length; circles,
outliers. Linear modeling indicated that mean F differed significantly between several regions (Mid-coast NSW–Southern Australia, P = 0.000524; Qld–Southern NSW, P = 0.00237; Qld–Southern Australia, P = 0.00000107; SE Qld–Southern Australia, P = 0.006596).
Distinct
PSMC profiles of the koalas from two geographic areas and their failure
to coalesce suggests some regional differences in koala populations,
including impediments to gene flow (Fig. 3a). Regional differentiation was also detected in analyses of mtDNA68,69, although over a shorter time scale.
We
analyzed populations of recent koala samples using 1,200 SNPs derived
from targeted capture libraries mapped to the koala genome (Supplementary Note).
We found notable levels of genetic diversity with limited fine-scale
differentiation consistent with long-term connectivity across regions.
We found evidence of low genetic diversity in southern koalas,
consistent with a recent history of sequential translocations8,68,70,71 (Fig. 3b,c).
At a continental scale, we show biogeographic barriers to gene flow
associated with the Brisbane Valley and Clarence River, as identified by
mtDNA studies68,72, and find a barrier associated with the Hunter Valley, which was not previously known in koalas (Fig. 3b). Levels of inbreeding varied across regions (Fig. 3c), but the northern populations most under threat in New South Wales and Queensland show high levels of genetic diversity.
The
information generated here provides a foundation for a conservation
management strategy to maintain gene flow regionally while incorporating
the genetic legacy of biogeographic barriers. Furthermore, the contrast
in genome-wide levels of diversity between southern and northern
populations highlights the detrimental consequences of the unmonitored
use of small isolated populations as founders for reestablishing and/or
rescuing of populations on genome-wide levels of genetic diversity. Low
levels of genetic diversity in southern koalas have been associated with
genetic abnormalities consistent with inbreeding depression, including
testicular abnormalities73.
Now
that we understand the consequences of past translocations, and the
existing genetic structure, it is clear that maintaining and
facilitating gene flow via habitat connectivity will be the most
effective means of ensuring genetically healthy koala populations over
the long term. However, where more intensive measures such as
translocation are required to rescue genetically depauperate southern
populations, these tools and data provide the basis for decisions that
maximize benefits while minimizing risks74,75.
Future utility of these SNPs will also include tracking of individual
pedigrees in captive koala populations and in those wild populations
being intensively monitored.
The koala genome offers insights into
historic and contemporary population dynamics, providing evolutionary
and genetic context for a species that is the focus of considerable
management actions and resources. By providing a deeper understanding of
disease dynamics and population genetic processes, including the
maintenance and monitoring of gene flow, this genomic information will
enable the development of strategies necessary to preserve the species,
from the preservation of habitat corridors through to the genetic rescue
of isolated populations. As members of government advisory committees,
some of the authors have initiated inclusion of genomic information into
the New South Wales Koala Strategy. This will be used to inform koala
management in the state with the goal of securing koalas in the wild for
the future.
Discussion
The
koala genome provides the highest quality marsupial genome to date.
This assembly has enabled insights into the colonization of the koala
genome by an exogenous retrovirus and revealed the architecture of the
immune system, necessary to study and treat emerging diseases that
threaten koala populations. A greater understanding of genetic diversity
across the species will guide the selection of individuals from
genetically healthy northern populations to augment genetically
restricted populations in the south, bearing in mind that chlamydia has
not been detected on some offshore islands, so risk assessment should be
carried out before embarking on translocations. Sequencing the genome
has advanced our understanding of the unique biology of the koala,
including detoxification pathways and innovations in taste and smell to
enable food choices in an obligate folivore. Long-term survival of the
species depends on understanding the impacts of disease and management
of genetic diversity, as well as the koala’s ability to source moisture
and select suitable foraging trees. This is particularly important given
the koala’s narrow food range, which makes it especially vulnerable to a
changing climate. The genome provides a springboard for conservation of
this biologically unique and iconic Australian species.
A full description of the Methods can be found in the Supplementary Note. No statistical methods were used to predetermine sample size.
Genome sequencing and assembly of the koala reference genome
Sequencing
Samples
were obtained as part of veterinary care at the Port Macquarie Koala
Hospital and Australia Zoo Wildlife Hospital, and from the Australian
Museum Tissue Collection. Sample collection was performed in accordance
with methods approved by the Australian Museum Animal Ethics Committee
(permit numbers 11–03 and 15–05). “Pacific Chocolate” (Australian Museum
registration M.45022), a female from Port Macquarie in northeast New
South Wales, was sampled immediately after euthanasia by veterinary
staff at the Port Macquarie Koala Hospital (27 June 2012), following
unsuccessful treatment of severe chlamydiosis. Two koalas from southeast
Queensland—a female, “Bilbo” (Australian Museum registration M.47724),
from Upper Brookfield, and a male, “Birke”, from Birkdale—were sampled
following euthanasia due to severe chlamydiosis (20 August 2015) and
severe injuries (26 August 2012), respectively. High molecular weight
(HMW) DNA was extracted from heart tissue for Pacific Chocolate and
kidney tissue for Birke using the DNeasy Blood and Tissue kit (Qiagen),
with RNaseA (Qiagen) treatment. HMW DNA from Bilbo was extracted for
PacBio sequencing from spleen tissue using Genomic-Tip 100/G columns
(Qiagen), DNA Buffer set (Qiagen) and RNaseA (Qiagen) treatment. Fifteen
SMRTbell libraries were prepared (RCG) as per the PacBio 20-kb template
preparation protocol, with an additional damage repair step performed
after size selection. A minimum size cutoff of 15 or 20 kb was used in
the size selection stage using the Sage Science BluePippin system. The
libraries were sequenced on the Pacific Biosciences RS II platform
(Pacific Biosciences) employing P6 C4 chemistry with either 240 min or
360 min movie lengths. A total of 272 SMRT Cells were sequenced to give
an estimated overall coverage of 57.3 × based on a genome size of 3.5
Gbp. A TruSeq DNA PCR free library was constructed with a mean library
insert size of 450 bp. 400,473,997 paired-end reads were generated
yielding a minimum coverage of 34 × . HMW gDNA was sequenced on an
Illumina 150bpPE HiSeq X Ten sequencing run (Illumina)
Assembly
Um algoritmo de montagem de consenso de layout sobreposto, FALCON (v 0.3.0) (ver URLs), foi usado para gerar o esboço do genoma usando leituras PacBio. A cobertura total do genoma antes da montagem foi estimada pelas bases totais das leituras divididas pelo tamanho do genoma de 3,5 Gbp. A cobertura total estimada é de 57,3 ×. O FALCON aproveita as leituras de sementes longas corrigidas por erros para gerar uma representação de consenso de layout sobreposto do genoma. Aproximadamente 23 × de leituras longas são requeridas pelo FALCON conforme as leituras de sementes, e o restante é usado para correção de erros. O comprimento de leitura das leituras no percentil de 60% foi calculado como 10.889 pb. O conjunto FALCON foi executado na região Amazon Web Service Tokyo usando instâncias spot r3.8xlarge como nó de cálculo, com o número de instâncias variando de 12 a 20, dependendo da disponibilidade.
Depois de filtrar leituras duplicadas e de baixa qualidade, foi utilizada uma cobertura de leitura longa de 57,3 vezes para montagem. Os contigs primios do conjunto FALCON v 0.3.0 (representando regis homozigicas do genoma) produziram a vers genoma phaCin_unsw_v4.1. Isso compreendeu 3,19 Gb, incluindo 1.906 contigs com uma N50 de 11,6 Mb e tamanhos variando de até 40,6 Mb. As regiões heterozigóticas do genoma (representando os contigs alternativos da montagem) foram um total de 230 Mb, com um N50 de 48,8 Kb (Tabela 2 Complementar). Aproximadamente 30 vezes a cobertura das leituras curtas da Illumina foi usada para polir a montagem com Pilon86.
BUSCO
analysis on the draft assembly was run against the mammalian ortholog
database with the –long parameter on all genomes under comparison. This
initial analysis showed the assembly only reached about 60% of genome
completeness, suggesting a high number of indels in the draft genome.
The genome polishing tool Pilon86
was employed to improve draft assembly from FALCON. About 30 × of
150 bp paired-end Illumina X Ten short reads from Bilbo was used as an
input for this polishing process, which was run on a compute cluster
provided by Intersect Australia Limited.
We implemented the method of Deakin et al.18
for super-scaffolding. Briefly, tables of homologous genes were
generated using the physical order of genes on the chromosomes of gray
short-tailed opossum and tammar wallaby as references and koala
phaCin_unsw_v4.1 (Bilbo) as target (Supplementary Table 4).
Analysis of centromeric regions and repeat structure
Repeat
content was called using RepeatMasker with combined RepBase libraries
(v 2015-08-07) and RepeatModeller calls generated from the genome
assemblies. The resulting calls were then filtered using custom Python
scripts to remove short fragments (see “Code availability”) and combine
tandem or overlapping repeat calls. To characterize the centromeric
regions of the genome, chromatin immunoprecipitation (ChIP) was
performed using the Invitrogen MAGnify Chromatin Immunoprecipitation
System (Revision 6). Repeat content of the centromeric regions was
determined using RepBase annotated marsupial repeats and output from
RepeatModeller analysis of koala. RepeatMasker was used to locate
repeats. Candidate centromeric segments were identified using two
sliding window analyses, with window sizes of 200 kb and 20 kb and step
sizes of 100 kb and 10 kb, respectively. Small tandem repeats were
discovered in koala RSX sequence using the Tandem Repeat Finder program87,
using +2, –3, and –7 as scores for match, mismatch and gap opening,
respectively. Alignments of consensus repeat units with the RSX sequence were processed to obtain nucleotide frequency at each position.
Genome annotation and gene family analysis
Annotations were generated using the automated genome annotation pipeline MAKER88,89]. We masked repeats in the assembly by providing MAKER with a koala-specific repeat library generated with RepeatModeler90, against which RepeatMasker (v 4.0.3)91 queried genomic contigs. Gene annotations were made using a protein database combining the UniProt/Swiss-Prot92 protein database, all sequences for human (Homo sapiens), gray short-tailed opossum (Monodelphis domestica), Tasmanian devil (Sarcophilus harrisii) and tammar wallaby (Notamacropus eugenii) from the NCBI protein database93, and a curated set of marsupial and monotreme immune genes94. We downloaded all published koala mRNAseq reads from SRA (PRJNA230900, PRJNA327021) and reassembled de novo male, female and mammary transcriptomes using the default parameters of Trinity v 2.3.295.
Each assembly was filtered such that contigs accounting for 90% of
mapped reads were passed to MAKER as homologous transcript evidence. Ab
initio gene predictions were made using the programs SNAP96, Genemark97 and Augustus98. Three iterative runs of MAKER were used to produce the final gene set.
Gene families were called using NCBI Blast (2.3.0) OrthoMCL (2.0.9)99. The protein sequences of genes belonging to orthogroups identified by OrthoMCL were aligned using MAFFT (7.2.71)100 and the gene tree was inferred using TreeBeST (1.9.2)101
providing a species tree to guide the phylogenetic reconstruction.
Custom scripts (see “Code availability”) were applied to identify
families with expansion within the koala, Diprotodontia, Australidelphia
and marsupial lineages.
Sequence evolution
Sequence evolution on specific gene families was conducted on the cytochrome P450 (CYP), vomeronasal receptor (V1R), olfactory receptor (OR), aquaporin and taste receptor genes (Supplementary Note). Genes involved in koala development and reproduction and lactation were also characterized (Supplementary Note). Koala MHC, TCR and IGG genes were annotated and analyzed for expression between diseased and healthy animals (Supplementary Note). Evidence of selection across CYP and V1R genes was evaluated (Supplementary Note) using multispecies alignments (N = 152 and 8 sequences, respectively) in HyPhy102, hosted by the Datamonkey webserver103.
RNA-seq analysis of koala conjunctival tissue samples
Conjunctival
tissue samples were collected from 26 koalas euthanized due to injury
or disease by veterinarians at Australia Zoo Wildlife Hospital,
Currumbin Wildlife Hospital and Moggill Koala Hospital. The collection
protocol was approved by the University of the Sunshine Coast Animal
Ethics Committee (AN/S/15/36). Health assessments of the eye were
performed by an experienced veterinarian and classified as either
‘healthy’ (N = 13) or ‘diseased’ (N = 13) based on evidence of gross pathology consistent with ocular chlamydiosis55.
Conjunctival tissue samples from each animal were placed directly in
RNALater (Qiagen, Germany) buffer overnight at 4 °C before storing at
–80 °C for later use. RNA was extracted using an RNeasy Mini Kit
(Qiagen, Germany) according to the manufacturer’s instructions, with an
on-column DNase treatment to eliminate contaminating DNA from the
sample. The concentration and quality of the isolated RNA was determined
using a NanoDrop ND-1000 160 Spectrophotometer and Agilent BioAnalyzer
(Agilent, USA). Library construction and sequencing were performed by
the Ramaciotti Centre (UNSW, Kensington, NSW) with TruSeq stranded mRNA
chemistry on a NextSeq500 (Illumina, USA). Reads were mapped to the
phCin_unsw_v4.1 assembly using the default parameters of STAR104 and counts summed over features using featureCounts105. Differentially expressed genes were called using DESeq2106 as implemented in the SARTools package107.
Koala retrovirus (KoRV)
We
searched for KoRV sequences within the scaffolds of the phaCin_unsw
v4.1 assembly of the Bilbo genome sequence, and also within alternative
contig sequences before their correction by Pilon (since we noticed that
in a few cases KoRV sequences were removed in the course of the
sequence polishing process). KoRV sequences were found by using the
program blastn108 to search with KoRV genome reference sequences (GenBank AF151794 and AB721500).
Search results were converted to BED format and the KoRV and recKoRV
components of each read were merged with the program mergeBed. KoRV
insertions within genes were identified using the program intersectBed109. Pre-integration allelic sequences were found by using blastn108
to search the phaCin_unsw v4.1 genome sequence assembly with sequences
flanking KoRV/recKoRV integrations as queries. In two cases the expected
allelic sequence was not present in the Bilbo genome, but was found by
searching the genome of another koala (Pacific Chocolate). To check the
expected relationship between pairs of allelic sequences, we inspected
dot plot alignments of representative sequences (not shown) created with
the program dotter110.
Koala population genomics: historical population size
Demographic
history was inferred from the diploid sequence of each of the three
koalas, using a pairwise sequential Markovian coalescent (PSMC) method65.
We conducted a range of preliminary analyses and found that PSMC plots
were not sensitive to the values chosen for the maximum number of
iterations (N), the number of free atomic time intervals (p), the maximum time to the most recent common ancestor (t), and the initial value of ρ. Based on these investigations, our final PSMC analyses of the three genome sequences used values of N = 25, t = 5, ρ = 1 and p = 4 + 25 × 2 + 4 + 6. The number of atomic time intervals is similar to that recommended for analyses of modern human genomes65, which are similar in size to the koala genomes. We determined the variance in estimates of Ne using 100 bootstrap replicates. Replicate analyses in which we varied the values of p, t and ρ produced PSMC plots that were broadly similar to those using our chosen ‘optimal’ settings (Supplementary Fig. 10).
The
plots of demographic history were scaled using a generation length of 7
years, corresponding to the midpoint of the range of 6 to 8 years
estimated for the koala111 and the midpoints of the estimates of the human mutation rate (1.45 × 10⁻⁸ mutations per site per generation; summarized by ref. 112) and mouse mutation rate (5.4 × 10⁻⁹ mutations per site per generation113) were applied in the absence of a mutation rate estimate for koala (Supplementary Fig. 10).
The koala mutation rate is likely to be closer to that of humans, based
on greater similarity in genome size, life history, and effective
population size, relative to mouse112.
Koala population genomics: contemporary population analysis
Forty-nine
koalas were sampled throughout the distribution using a hierarchical
approach to allow examination of genetic relationships at a range of
scales, from familial to range-wide. All individuals were sequenced
using a target capture approach described in ref. 114, with a kit targeting 2,167 marsupial exon sequences. Illumina sequence reads were quality-filtered and trimmed (see ref. 114 for details) and mapped to the koala genome (Bowtie2, v2.2.4115). A panel of 4,257 SNP sites was identified (using GATK version 3.3-0-g37228af116)
that showed expected levels of relatedness and differentiation among
the sampled individuals. A panel of 1,200 SNPs (obtained by mapping to
targets, filtering, and selecting one SNP per target) showed fine-scale
regional differentiation consistent with evolutionary history and recent
population management (Fig. 3).
Statistics and reproducibility
In Fig. 1e,
points shown indicate the mean empirical Bayes factor (EBF) for sites
under selection; error bars, 95% confidence interval. In Fig. 1f–h, 95% confidence intervals are calculated as 1.96 × s.e.m. (sample size is sequence depth, as indicated by red bars in Fig. 1c).
In Fig. 3c, center lines indicate median and box limits indicate upper and lower quartiles. Upper whisker = min(max(x), Q_3 + 1.5 × IQR), lower whisker = max(min(x),
Q_1 – 1.5 × IQR); i.e., upper whisker = upper quartile + 1.5 × box
length, lower whisker = lower quartile – 1.5 × box length. Circles
indicate outliers. Linear modeling indicated that mean F differed significantly between several regions (Midcoast New South Wales–Southern Australia, P = 0.000524; Queensland–Southern New South Wales, P = 0.00237; Queensland–Southern Australia, P = 0.00000107; Southeast Queensland–Southern Australia, P = 0.006596).
(1)
Custom scripts to identify gene families with expansion within the
koala, Diprotodontia, Australidelphia and marsupial lineages; (2) custom
scripts to identify refined repeat calls; and (3) code used to generate
SNP genotypes from exon capture data are available at https://github.com/DrRebeccaJ/KoalaGenome.
Data availability
The Phascolarctos cinereus BioSamples are as follows: Bilbo 61053, SAMN06198159; Pacific Chocolate, SAMEA91939168; Birke. SAMEA103910665.
Koala Genome Consortium Projects for the Koala Whole Genome Shotgun
project and genome assembly are registered under the umbrella BioProject
PRJEB19389 (union of PRJEB5196 and PRJNA359763).
Transcriptome data are submitted under PRJNA230900 (adrenal, brain, heart, lung, kidney, uterus, liver and spleen) and PRJNA327021 (milk and mammary gland). Illumina short-read data for Birke is submitted under PRJEB19982.
The Bilbo 61053 assembly described in this paper is version MSTS01000000 and consists of sequences MSTS01000001–MSTS01001906. For the Bilbo assembly Illumina X Ten reads are submitted under PRJEB19457 and PacBio reads under PRJEB19889.
ChIP-seq data have been deposited under BioProject PRJNA415832 and GEO GSE111153.
Additional information
Publisher’s note: Springer Nature remains neutral with regard to jurisdictional claims in published maps and institutional affiliations.
References
1.
Meredith,
R. W., Krajewski, C., Westerman, M. & Springer, M. S. Relationships
and divergence times among the orders and families of Marsupialia. Mus. North. Ariz. Bull.65, 383–406 (2009).
Black,
K. H., Price, G. J., Archer, M. & Hand, S. J. Bearing up well?
Understanding the past, present and future of Australia’s koalas. Gondwana Res.25, 1186–1201 (2014).
Gleadow, R. M., Haburjak, J., Dunn, J. E., Conn, M. E. & Conn, E. E. Frequency and distribution of cyanogenic glycosides in Eucalyptus L’Hérit. Phytochemistry69, 1870–1874 (2008).
Nagy, K. & Martin, R. Field metabolic rate, water flux, food consumption and time budget of koalas, Phascolarctos cinereus (Marsupialia: Phascolarctidae) in Victoria. Aust. J. Zool.33, 655–665 (1985).
Woinarski,
J. C., Burbidge, A. A. & Harrison, P. L. Ongoing unraveling of a
continental fauna: decline and extinction of Australian mammals since
European settlement. Proc. Natl. Acad. Sci. USA112, 4531–4540 (2015).
Adams-Hosking, C. et al. Use of expert knowledge to elicit population trends for the koala (Phascolarctos cinereus). Divers. Distrib.22, 249–262 (2016).
Menkhorst, P. Hunted, marooned, re-introduced, contracepted: a history of koala management in Victoria. in Too Close for Comfort: Contentious Issues in Human–Wildlife Encounters (eds. Lunney, D. et al.) 73–92 (Royal Zoological Society of NSW, Mosman, New South Wales, Australia, 2008).
11.
Seymour,
A. M. et al. High effective inbreeding coefficients correlate with
morphological abnormalities in populations of South Australian koalas (Phascolarctos cinereus). Anim. Conserv.4, 211–219 (2001).
Simmons,
G., Clarke, D., McKee, J., Young, P. & Meers, J. Discovery of a
novel retrovirus sequence in an Australian native rodent (Melomys burtoni): a putative link between gibbon ape leukemia virus and koala retrovirus. PLoS One9, e106954 (2014).
Alfano, N. et al. Endogenous gibbon ape leukemia virus identified in a rodent (Melomys burtoni subsp.) from Wallacea (Indonesia). J. Virol.90, 8169–8180 (2016).
Deakin, J. E. et al. Anchoring genome sequence to chromosomes of the central bearded dragon (Pogona vitticeps) enables reconstruction of ancestral squamate macrochromosomes and identifies sequence content of the Z chromosome. BMC Genomics17, 447 (2016).
Earnshaw,
W. C. & Rothfield, N. Identification of a family of human
centromere proteins using autoimmune sera from patients with
scleroderma. Chromosoma91, 313–321 (1985).
O’Neill,
R. J. W., O’Neill, M. J. & Graves, J. A. M. Undermethylation
associated with retroelement activation and chromosome remodelling in an
interspecific mammalian hybrid. Nature393, 68–72 (1998).
Carbone, L. et al. Centromere remodeling in Hoolock leuconedys (Hylobatidae) by a new transposable element unique to the gibbons. Genome Biol. Evol.4, 648–658 (2012).
Hobbs, M. et al. A transcriptome resource for the koala (Phascolarctos cinereus): insights into koala retrovirus transcription and sequence diversity. BMC Genomics15, 786 (2014).
Simão,
F. A., Waterhouse, R. M., Ioannidis, P., Kriventseva, E. V. &
Zdobnov, E. M. BUSCO: assessing genome assembly and annotation
completeness with single-copy orthologs. Bioinformatics31, 3210–3212 (2015).
Foley,
W. J. & Moore, B. D. Plant secondary metabolites and vertebrate
herbivores–from physiological regulation to ecosystem function. Curr. Opin. Plant Biol.8, 430–435 (2005).
Eschler,
B. M., Pass, D. M., Willis, R. & Foley, W. J. Distribution of
foliar formylated phloroglucinol derivatives amongst Eucalyptus species.
Biochem. Syst. Ecol.28, 813–824 (2000).
Pass,
G. J., McLean, S., Stupans, I. & Davies, N. Microsomal metabolism
of the terpene 1,8-cineole in the common brushtail possum (Trichosurus vulpecula), koala (Phascolarctos cinereus), rat and human. Xenobiotica31, 205–221 (2001).
Ngo, S. N. T., McKinnon, R. A. & Stupans, I. Cloning and expression of koala (Phascolarctos cinereus) liver cytochrome P450 CYP4A15. Gene376, 123–132 (2006).
Kirischian,
N., McArthur, A. G., Jesuthasan, C., Krattenmacher, B. & Wilson, J.
Y. Phylogenetic and functional analysis of the vertebrate cytochrome
P450 2 family. J. Mol. Evol.72, 56–71 (2011).
Davies,
N. M. & Skjodt, N. M. Clinical pharmacokinetics of meloxicam. A
cyclo-oxygenase-2 preferential nonsteroidal anti-inflammatory drug. Clin. Pharmacokinet.36, 115–126 (1999).
Blanshard, W. & Bodley, K. Koalas. in Medicine of Australian Mammals (eds. Vogelnest, L. & Woods, R.) 307–327 (Csiro Publishing, Melbourne, Victoria, Australia, 2008).
40.
Villalba,
J. J., Provenza, F. D. & Bryant, J. Consequences of the interaction
between nutrients and plant secondary metabolites on herbivore
selectivity: benefits or detriments for plants? Oikos97, 282–292 (2002).
Moore,
B. D., Foley, W. J., Wallis, I. R., Cowling, A. & Handasyde, K. A.
Eucalyptus foliar chemistry explains selective feeding by koalas. Biol. Lett.1, 64–67 (2005).
Freeland, W.J. & Janzen, D.H. Strategies in herbivory by mammals: the role of plant secondary compounds. Am. Nat. 108, 269–289 https://doi.org/10.1086/282907 (1974).
44.
McBride, C. S. Rapid evolution of smell and taste receptor genes during host specialization in Drosophila sechellia. Proc. Natl. Acad. Sci. USA104, 4996–5001 (2007).
Gilbertson, T. A., Baquero, A. F. & Spray-Watson, K. J. Water taste: the importance of osmotic sensing in the oral cavity. J. Water Health4, 35–40 (2006).
Hayakawa,
T., Suzuki-Hashido, N., Matsui, A. & Go, Y. Frequent expansions of
the bitter taste receptor gene repertoire during evolution of mammals in
the Euarchontoglires clade. Mol. Biol. Evol.31, 2018–2031 (2014).
Johnston,
S. D., McGowan, M. R., O’Callaghan, P., Cox, R. & Nicolson, V.
Studies of the oestrous cycle, oestrus and pregnancy in the koala (Phascolarctos cinereus). J. Reprod. Fertil.120, 49–57 (2000).
Morris,
K. M. et al. Characterisation of the immune compounds in koala milk
using a combined transcriptomic and proteomic approach. Sci. Rep.6, 35011 (2016).
Department of the Environment. Phascolarctos cinereus
(combined populations of Queensland, New South Wales and the Australian
Capital Territory) in Species Profile and Threats Database (Department
of the Environment, Canberra, Australian Capital Territory, 2016).
55.
Polkinghorne,
A., Hanger, J. & Timms, P. Recent advances in understanding the
biology, epidemiology and control of chlamydial infections in koalas. Vet. Microbiol.165, 214–223 (2013).
Rhodes,
J. R. et al. Using integrated population modelling to quantify the
implications of multiple threatening processes for a rapidly declining
population. Biol. Conserv.144, 1081–1088 (2011).
Morris, K. et al. The koala immunological toolkit: sequence identification and comparison of key markers of the koala (Phascolarctos cinereus) immune response. Aust. J. Zool.62, 195–199 (2014).
Morris, K. M. et al. Identification, characterisation and expression analysis of natural killer receptor genes in Chlamydia pecorum infected koalas (Phascolarctos cinereus). BMC Genomics16, 796 (2015).
Jones,
E. A., Cheng, Y., O’Meally, D. & Belov, K. Characterization of the
antimicrobial peptide family defensins in the Tasmanian devil (Sarcophilus harrisii), koala (Phascolarctos cinereus), and tammar wallaby (Macropus eugenii). Immunogenetics69, 133–143 (2017).
Burton,
M. J. et al. Pathogenesis of progressive scarring trachoma in Ethiopia
and Tanzania and its implications for disease control: two cohort
studies. PLoS Negl. Trop. Dis.9, e0003763 (2015).
Derrick,
T., Roberts, C., Last, A. R., Burr, S. E. & Holland, M. J. Trachoma
and ocular chlamydial infection in the era of genomics. Mediators Inflamm.2015, 791847 (2015).
Field,
J., Wroe, S., Trueman, C. N., Garvey, J. & Wyatt-Spratt, S. Looking
for the archaeological signature in Australian megafaunal extinctions. Quat. Int.285, 76–88 (2013).
Taylor, A. C., Graves, J. A., Murray, N. D. & Sherwin, W. B. Conservation genetics of the koala (Phascolarctos cinereus). II. Limited variability in minisatellite DNA sequences. Biochem. Genet.29, 355–363 (1991).
Taylor, A. C. et al. Conservation genetics of the koala (Phascolarctos cinereus): low mitochondrial DNA variation amongst southern Australian populations. Genet. Res.69, 25–33 (1997).
Dennison, S. et al. Population genetics of the koala (Phascolarctos cinereus) in north-eastern New South Wales and south-eastern Queensland. Aust. J. Zool. 64, 402–412 (2017).
73.
Cristescu, R. et al. Inbreeding and testicular abnormalities in a bottlenecked population of koalas (Phascolarctos cinereus). Wildl. Res.36, 299–308 (2009).
O’Connell,
J. F. & Allen, J. The process, biotic impact, and global
implications of the human colonization of Sahul about 47,000 years ago. J. Archaeol. Sci.56, 73–84 (2015).
Renfree, M. B. et al. Genome sequence of an Australian kangaroo, Macropus eugenii, provides insight into the evolution of mammalian reproduction and development. Genome Biol.12, R81 (2011).
Walker, B. J. et al. Pilon: an integrated tool for comprehensive microbial variant detection and genome assembly improvement. PLoS One9, e112963 (2014).
Holt,
C. & Yandell, M. MAKER2: an annotation pipeline and genome-database
management tool for second-generation genome projects. BMC Bioinformatics12, 491 (2011).
Smit, A., Hubley, R. & Green, P. RepeatModeler Open-1.0. 2008–2015 (2014).
91.
Smit, A., Hubley, R. & Green, P. RepeatMasker Open-4.0. 2013–2015 (2015).
92.
Boutet,
E. et al. UniProtKB/Swiss-Prot, the manually annotated section of the
UniProt KnowledgeBase: how to use the entry view. in Plant Bioinformatics: Methods and Protocols (ed. Edwards, D.) 23–54 (2016).
93.
O’Leary,
N. A. et al. Reference sequence (RefSeq) database at NCBI: current
status, taxonomic expansion, and functional annotation. Nucleic Acids Res.44, D733–D745 (2016).
Borodovsky,
M. & Lomsadze, A. Gene identification in prokaryotic genomes,
phages, metagenomes, and EST sequences with GeneMarkS suite. Curr. Protoc. Bioinformatics4, 4.5.1–4.5.17 (2011).
Katoh,
K. & Standley, D. M. MAFFT multiple sequence alignment software
version 7: improvements in performance and usability. Mol. Biol. Evol.30, 772–780 (2013).
Pond, S.L.K. & Muse, S.V. HyPhy: hypothesis testing using phylogenies. in Statistical Methods in Molecular Evolution 125–181 (Springer, New York, 2005).
103.
Delport,
W., Poon, A. F., Frost, S. D. & Kosakovsky Pond, S. L. Datamonkey
2010: a suite of phylogenetic analysis tools for evolutionary biology. Bioinformatics26, 2455–2457 (2010).
Liao,
Y., Smyth, G. K. & Shi, W. featureCounts: an efficient general
purpose program for assigning sequence reads to genomic features. Bioinformatics30, 923–930 (2014).
Sonnhammer,
E. L. & Durbin, R. A dot-matrix program with dynamic threshold
control suited for genomic DNA and protein sequence analysis. Gene167, GC1–GC10 (1995).
Uchimura,
A. et al. Germline mutation rates and the long-term phenotypic effects
of mutation accumulation in wild-type laboratory mice and mutator mice. Genome Res.25, 1125–1134 (2015).
Bragg, J. G., Potter, S., Bi, K. & Moritz, C. Exon capture phylogenomics: efficacy across scales of divergence. Mol. Ecol. Resour.16, 1059–1068 (2016).
McKenna, A. et al. The Genome Analysis Toolkit: a MapReduce framework for analyzing next-generation DNA sequencing data. Genome Res.20, 1297–1303 (2010).
R.N.J.
and the Australian Museum acknowledge the Australian Museum Foundation,
Bioplatforms Australia, New South Wales Environmental Trust grant
2014/RD/0015, Australian Research Council LIEF Grant LE160100154, the
University of Sydney HPC service and Amazon Web Services for support;
and C. Staples from Featherdale Wildlife Park, C. Flanagan from Port
Macquarie Koala Hospital, J. Hangar, E. Hynes, J. Reed, S. Ingleby, A.
Divljan and S. Ginn for assistance with sample acquisition. K.B.
acknowledges support from the Australian Research Council and
Bioplatforms Australia. M.R.W. and the Ramaciotti Centre for Genomics
acknowledge support from the Australian Research Council, from the
Australian Government NCRIS scheme via Bioplatforms Australia, the New
South Wales State Government RAAP scheme and the University of New South
Wales. W.H. and W.J.N. were supported by strategic BBSRC funding
(Institute Strategic Programme Grant BB/J004669/1) and by the NBI
Computing Infrastructure for Science (CiS) group. A.D.G., K.M.H and K.T.
were supported by grant R01GM092706 from the National Institute of
General Medical Sciences (NIGMS) and A.D.G. had additional support from
Morris Animal Foundation grant D14ZO-94. T.N.H., Z.D. and R.J.O. were
supported by awards from the National Science Foundation 1613806 and the
facilities within the Center for Genome Innovation at the University of
Connecticut. C.E.H. thanks CSIRO National Research Collections
Australia funding. K.B. and A.P. thank the veterinary staff at Australia
Zoo Wildlife Hospital, Currumbin Wildlife Hospital and Moggill Koala
Hospital for their assistance in the collection of samples for the koala
conjunctival transcriptome study. T.H. acknowledges the Kyoto
University Research Administration Office (KURA) for support and was
financed by JSPS KAKENHI grant number 16K18630 and the Sasakawa
Scientific Research Grant from the Japan Science Society. A.P. and P.T.
acknowledge financial support from the Australian Research Council and
A.G. financial support via Australian Research Council Discovery Grant
DP110104377. C.M.W. is supported by a University of Sydney research
fellowship from the estate of Mabs Melville. All authors thank
Bioplatforms Australia and Pacific Biosciences. The authors thank T.
Haydon for valuable editorial input; S. Potter for expert technical
assistance; and R. Gleadow, C. Frere, D. Lunney and D. Alvarez-Ponce for
valuable discussions on content.
Author information
Author notes
These
authors contributed equally: Rebecca N. Johnson, Denis O’Meally,
Zhiliang Chen, Marc R. Wilkins, Peter Timms, Katherine Belov.
These authors jointly supervised this work: Rebecca N. Johnson, Katherine Belov.
Affiliations
Australian Museum Research Institute, Australian Museum, Sydney, New South Wales, Australia
Rebecca N. Johnson
, Siobhan Dennison
, Don Colgan
, David E. Alquezar-Planas
, Val Attenbrow
, Mark D. B. Eldridge
, Kyle M. Ewart
, Greta J. Frankham
, Kristofer M. Helgen
, Matthew Hobbs
, Andrew King
, Linda E. Neaves
& Belinda Wright
School of Life and Environmental Sciences, Faculty of Science, University of Sydney, Sydney, New South Wales, Australia
Rebecca N. Johnson
, Denis O’Meally
, Simon Y. W. Ho
, Catherine E. Grueber
, Yuanyuan Cheng
, Emma Peel
, Parice A. Brandies
, Carolyn J. Hogg
, Belinda Wright
& Katherine Belov
Animal
Research Centre, Faculty of Science, Health, Education &
Engineering, University of the Sunshine Coast, Maroochydore, Queensland,
Australia
Denis O’Meally
, Danielle Madden
& Adam Polkinghorne
School of Biotechnology and Biomolecular Sciences, University of New South Wales, Kensington, New South Wales, Australia
Zhiliang Chen
, Ryan Salinas
, Paul D. Waters
, Shafagh A. Waters
& Marc R. Wilkins
Earlham Institute, Norwich Research Park, Norwich, UK
Graham J. Etherington
, Will J. Nash
, Wilfried Haerty
, Amanda Yoon-Yee Chong
& Federica Di Palma
San Diego Zoo Global, San Diego, CA, USA
Catherine E. Grueber
UQ Genomics Initiative, University of Queensland, St Lucia, Queensland, Australia
Yuanyuan Cheng
Sydney School of Veterinary Science, Faculty of Science, University of Sydney, Sydney, New South Wales, Australia
Camilla M. Whittington
, Merran Govendir
& Elizabeth A. Jones
Department of Molecular and Cell Biology and Institute for Systems Genomics, University of Connecticut, Storrs, CT, USA
Rachel J. O’Neill
, Zachary Duda
& Thomas N. Heider
Ramaciotti Centre for Genomics, University of New South Wales, Kensington, New South Wales, Australia
Tonia L. Russell
& Marc R. Wilkins
Research School of Biology, Australian National University, Canberra, Australian Capital Territory, Australia
Jason G. Bragg
& Jennifer A. Marshall Graves
National Herbarium of New South Wales, Royal Botanic Gardens & Domain Trust, Sydney, New South Wales, Australia
Jason G. Bragg
Wellcome Centre for Human Genetics, Nuffield Department of Medicine, University of Oxford, Oxford, UK
Amanda Yoon-Yee Chong
Institute for Applied Ecology, University of Canberra, Bruce, Australian Capital Territory, Australia
Janine E. Deakin
, Arthur Georges
& Jennifer A. Marshall Graves
Department of Biological Sciences, University of East Anglia, Norwich, UK
Federica Di Palma
Australia Zoo Wildlife Hospital, Beerwah, Queensland, Australia
Amber K. Gillett
Department of Wildlife Diseases, Leibniz Institute for Zoo and Wildlife Research, Berlin, Germany
Alex D. Greenwood
Department of Veterinary Medicine, Freie Universität Berlin, Berlin, Germany
Alex D. Greenwood
Department of Wildlife Science (Nagoya Railroad Co., Ltd.), Primate Research Institute, Kyoto University, Inuyama, Japan
Takashi Hayakawa
Japan Monkey Centre, Inuyama, Japan
Takashi Hayakawa
School
of Biological Sciences, Environment Institute, Centre for Applied
Conservation Science, and ARC Centre of Excellence for Australian
Biodiversity and Heritage, University of Adelaide, Adelaide, South
Australia, Australia
Kristofer M. Helgen
Australian
National Wildlife Collection, National Research Collections Australia,
CSIRO, Canberra, Australian Capital Territory, Australia
Clare E. Holleley
School of Life Sciences, La Trobe University, Bundoora, Victoria, Australia
Jennifer A. Marshall Graves
The Roslin Institute and R(D)SVS, University of Edinburgh, Easter Bush, Midlothian, UK
Katrina M. Morris
Royal Botanic Garden Edinburgh, Edinburgh, UK
Linda E. Neaves
John Curtin School of Medical Research, Australian National University, Acton, Australian Capital Territory, Australia
Hardip R. Patel
School of BioSciences, University of Melbourne, Melbourne, Victoria, Australia
Marilyn B. Renfree
& Charles Robin
Department of Translational Genetics, The Cyprus Institute of Neurology and Genetics, Nicosia, Cyprus
Kyriakos Tsangaras
Faculty of Science, Health, Education & Engineering, University of the Sunshine Coast, Maroochydore, Queensland, Australia
Peter Timms
Contributions
R.N.J.,
K.B., P.T. and M.R.W. designed the original concept and scientific
objectives and oversaw the project and analyses. R.N.J., D.C., M.D.B.E.,
A.K.G., D.O., A.K. and P.T. acquired samples for sequencing. T.L.R.,
M.R.W., Z.C., D.O., G.J.E. and F.D.P. performed library preparation,
genome sequencing, assembly and annotation. S.Y.W.H. performed PSMC
analysis. A.Y.-Y.C. characterized repetitive sequences. R.J.O., T.N.H.
and Z.D. characterized centromeric and telomeric regions. C.M.W. and
M.B.R. annotated and analyzed reproductive and developmental genes.
K.M.M. annotated and analyzed lactation genes. T.H. and D.C. annotated
and analyzed TAS1R and TAS2R genes. H.R.P. annotated and analyzed OR genes. D.C. annotated and analyzed aquaporin genes. K.B., Y.C., P.A.B., E.A.J., D.O. and E.P. annotated and analyzed MHC, Ig, TCR, NK
and antimicrobial genes. A.P., K.B., D.O. and D.M. analyzed the ocular
RNA-seq data. P.A.B., B.W., C.E.G., P.T., K.B. and A.P investigated
candidate genes for chlamydia vaccine response. P.T., M.R.W., R.S.,
M.H., A.K., A.D.G. and K.T. characterized retrovirus insertions and
wrote the KoRV sections of the manuscript. J.G.B., S.D., M.D.B.E.,
G.J.F., L.E.N., R.N.J., B.W. and C.J.H. contributed to analyses and
interpretation of exon capture sequence data. P.D.W., S.A.W. and H.R.P.
annotated and analyzed RSX data. W.J.N., C.E.G., Y.C., W.H., F.D., M.G., K.M.E., B.W. and C.R. analyzed CYP genes. C.E.G. and C.M.W. analyzed V1R
genes. J.E.D., A.G. and H.R.P. constructed super-scaffolds. J.A.M.G.,
V.A., F.D., C.J.H., K.M.H., A.P., B.W., D.C., M.H., D.E.A.-P., P.A.B.,
L.E.N., C.E.G., S.A.W. and C.E.H. provided constructive feedback on data
analysis and interpretation. R.N.J., P.T., K.B., M.R.W., A.P., M.D.B.E.
and G.J.F. obtained funding and other resources. R.N.J. and K.B. wrote
the manuscript with input from all other authors.
Included
in greater detail is the order Diprotodontia (shaded green) -
represented as the three superorders Macropodiformes, Phalangeriformes
and Vombatiformes, the latter including families Vombatidae (wombats)
and Phascolarctidae (koalas). Included is diversity of extinct koala
fossil locations and estimated extinction dates (depicted in maroon on
the map). There is evidence for up to 16 species in the family
Phascolarctidae, with ~3 species coexisting at any one time 1,2,*,†. The genus Phascolarctos
first appeared during the Pliocene (4.5-2 mya) and the modern koala
more recently with fossil evidence dating from 350 ka (depicted in on
the map green with current range in purple). Graph depicts estimated
population numbers of P. cinereus over last 100,000 years.
*Munemasa, M. et al. Phylogenetic analysis of diprotodontian marsupials
based on complete mitochondrial genomes. Genes Genet. Syst. 81, 181–191 (2006).†May-Collado,
L.J., Kilpatrick, C.W. & Agnarsson, I. Mammals from ‘down under’: a
multi-gene species-level phylogeny of marsupial mammals (Mammalia,
Metatheria). PeerJ3, e805 (2015).
Homology
amongst marsupial chromosomes was determined previously from
cross-species chromosome painting, which divided marsupial genomes into
19 conserved segments* and could be extrapolated to all previously
G-banded marsupial karyotypes†. Koala chromosome 7
corresponds to conserved segments C7 and C8, which are located on the
short arm of wallaby chromosome 7 and long arm of tammar wallaby
chromosome 1 respectively, and on the short arm of opossum chromosome 1
(insert). The contigs (indicated by different colours) making up each
koala supercontig and the size of the supercontigs are indicated. The
tammar wallaby scaffold identifier numbers have also been provided. Gray
short-tailed opossum chromosome 1 has been used as a reference as the
sequence has been oriented on the gray short-tailed opossum chromosome 83. *Rens, W. et al. Reversal and convergence in marsupial chromosome evolution. Cytogenet. Genome Res. 102, 282–290 (2003).†Deakin, J.E., Graves, J.A. & Rens, W. The evolution of marsupial and monotreme chromosomes. Cytogenet. Genome Res. 137, 113–129 (2012).
a-b, Graphs of the percentage of marsupial annotated repeats between a, CENP-A-IP (purple) and Input (teal) and b,
CREST-IP (purple) and Input (teal). Equal enrichment between IP and
Input is represented by 50% distribution for each repeat and deviation
from 50% indicates enrichment in either IP or Input. c, Heatmap
of sequence divergence for the ChIP-Seq Peaks and whole genome. The
color in the legend represents the percent divergence from the model
sequence. Both rows and columns were clustered using Euclidean distance,
with each row representing a different region of the genome and each
column representing a particular repetitive sequence. The ChIP-Seq peaks
are labeled by appending –Bed1 along the right of the heatmap and blue
along the left, while the genomic scaffolds are labeled by appending
–bed2 along the region labels on the right and with a red mark on the
left of the heatmap. d-g, A principal component analysis was performed using the length of repeat normalised to the length of the region (d and f of each pair) and each region's average divergence from the model of each repeat in that region (e and g
of each pair). For these analyses, the top 2,000 ChIP-seq peaks (for
both the CENP-A and CREST ChIP experiments), containing 48,090 unique
repeats, were compared to the genome assembly broken into 33,209
regions/windows (200kb in size), containing 7,038,290 unique repeats.
Regions derived from the ChIP-Seq peaks are labelled with red/Bed1 while
the whole genome scaffolds are labelled with blue/Bed2. The scatter of
points from each set of regions is also shown with the ChIP-Seq regions
being show with a light red circle, the regions from the whole genome
shown with a blue circle and the total diversity of all of the regions
shown in a dark red circle. d-e, marsupial repeat models; f-g, de novo repeat models.
RSX mediates marsupial X-chromosome inactivation 26. It is functionally analogous to the eutherian specific Xist gene, but is independently evolved. a, Koala scaffolds aligned to the gray short-tailed opossum X. Red lines are reciprocal best hits of protein coding genes. RSX
is located on a 5.9 Mbp scaffold (scaff00196), on which gene order is
completely conserved with gray short-tailed opossum. Gene mapping and
chromosome painting* has demonstrated that gene content of the X is
conserved across all marsupials studied to date, but gene order is not.
The koala X is no exception, being rearranged relative to the X of both
wallaby and gray short-tailed opossum. b, Sequence similarity plot of koala RSX
to itself. There were three repeat arrays detected (coloured arrows).
Sequence logos show base frequency of the consensus 33 bp repeat in the
5’ 12kb array (red arrow), and a 31 bp repeat detected in the middle 5.2
kb array (blue arrow). The third 1.75 kb repeat array (green arrow) had
a 152 bp repeat with 8 copies. These three repeat arrays are conserved
in gray short-tailed opossum RSX (Supplementary information: Fig. 1). c,
Alignment of the consensus koala 33 bp repeat from the 12kb array, with
the consensus 34 bp repeat from opossum. Above the alignment is the
minimum free energy predicted† stem-loop formed by the
palindromes (shaded on the alignment) in koala, and below the alignment
the stem-loop predicted in gray short-tailed opossum. Each base is
coloured according to base-pairing probability. *Deakin, J.E. et al.
Reconstruction of the ancestral marsupial karyotype from comparative
gene maps. BMC Evol. Biol. 13, 258 (2013). †Gruber, A.R., Lorenz, R., Bernhart, S.H., Neuböck, R. & Hofacker, I.L. The Vienna RNA websuite. Nucleic Acids Res. 36, W70–W74 (2008).
a Gene families that contained the largest number of genes in the koala. b
Gene families that contained more genes in the koala than in any other
member of the 9 species included in the OrthoMCL analysis (human, mouse,
dog, tammar wallaby, Tasmanian devil, gray short-tailed opossum,
platypus, chicken). c Gene families that contained more genes in
the Australian marsupials included in the analysis (koala, tammar
wallaby, Tasmanian devil, gray short-tailed opossum), than in the
eutherian mammals (human, mouse, dog) or out-groups (platypus, chicken).
Expression
(TPM) across 15 transcriptomes from two koalas showing an overall
higher expression of the CYP2 genes in the livers of the 2 koalas, with
correlation between the two individuals (spearman's rank correlation
coefficient = 0.928, P< 2.2e-16).
a
Each box depicts an exon with black vertical bars indicating a
sequencing error causing frameshift mutation. In the koala assembly, TAS1R1 and TAS1R2
have a frameshift mutation, respectively, but these are attributed to
PacBio assembly error (see below). In the tammar wallaby assembly, TAS1R1 and TAS1R3
have a frameshift mutation, respectively, which is due to Sanger
sequencing error (apparently miscalled in the trace data sequences of
the corresponding sites (e.g., NCBI TI numbers: 1378971959 and
1718787462 for TAS1R1 and 1437875519 and 1634206001 for TAS1R3)). The 1st exon of TAS1R2 in the gray short-tailed opossum assembly and the 6th exon of TAS1R2
in the Tasmanian devil assembly are completely truncated (missing in
the data). The inside of the 6th exon in the Tasmanian devil assembly is
truncated but intact in the alternative Tasmanian devil assembly
(GCA_000219685.1). Therefore, any TAS1Rs do not appear to be pseudogenized in these marsupials. b
Mapping results of Illumina short reads from the koala against the
PacBio assembly in the corresponding site of each frameshift mutation of
TAS1R1 and TAS1R2, which would be due to PacBio assembly
error because all Illumina short reads insert one base to restore the
open reading frame. Noted that these inserts are allelic variations,
which could cause such PacBio assembly error.
a Two highly expressed milk proteins with no known function or eutherian homologs, Very Early Lactation Protein (VELP) and Marsupial Milk 1 (MM1), were identified in the koala genome. We previously found that koala VELP shows homology to a eutherian antimicrobial protein, Glycam153. In the koala genome VELP is located in the region syntenic to Glycam1 confirming orthology. The MM1 gene is likely located close to VELP. In the syntenic region in the human genome is an array of short glycoproteins including lacritin, dermicidin, Glycam1 and mucin-like 1
– all antimicrobial proteins found in secretions such as milk, tears
and sweat. In koala, three short novel genes were also seen in this
region, including one that shows homology to lacritin and dermicidin.
Although direct orthology to any of the human proteins was not seen,
their location and similar length and structure indicate that MM1 and the additional novel genes may be related to this group of human antimicrobials, and may also have an antimicrobial role. b Koala milk-expressed lipocalins (Late Lactation Proteins (LLPs), B-lactoglobulin (LGB), Lipocalin-2 and Trichosurin (TRSN))
are clustered together on a scaffold together with a large number of
related lipocalin genes. Several of these genes are highly expressed in
koala milk and may serve nutritional roles. The group of lipocalin genes
appears to have expanded through gene duplications within the marsupial
lineage, particularly within the marsupial-specific LLP (4 genes) and
Trichosurin-related (7 genes) groups. These duplications may allow
marsupials to fine tune milk protein composition across the extended
lactation. * denotes partial gene. c Phylogeny of Late Lactation Protein (LLP) sequences across marsupials. LLP genes have a complex evolutionary history with duplications and deletions. One to four LLP proteins have been identified across marsupial species. This tree shows that some LLP
genes are conserved among Australian marsupials, while lineage specific
duplications occur in several species, including koala. The phylogeny
was constructed using the Maximum Likelihood method based on the JTT
matrix-based model. Scale units are number of amino acid substitutions
per site.
a
The core MHC region on scaffold#255 contains 138 genes. Out of 23
annotated class I loci, eight are located in this region, including one
classical and three nonclassical genes 59 and four pseudogenes. b The koala is the first Australian marsupial to have its TCR loci fully assembled and annotated. The koala TCR system contains the conventional α, β, δ, and γ chains, and an additional isotype class known as the TCR µ chain (encoded by TRM), which is unique to marsupials and monotremes and missing in eutherian mammals. The koala TRA/D, TRB, TRG, and TRM loci are each located on a single scaffold (scaffold1, 71, 153, and 59, respectively) in the PacBio assembly. The TRA/D locus contains 94 putatively functional gene segments, including 52 Vα, two Dδ, three Jδ, one Cδ, 35 Jα, and a Cα. The TRB locus contains 33 Vβ segments, and three sets of Dβ, Jβ, and Cβ segments arranged in tandem cassettes, each comprising one Dβ, two to four Jβ, and one Cβ. The TRG locus consists of four Vγ, four Jγ, and one Cγ. Four sets of TRM gene segment clusters, each consisting of one V, one or two D, one J, one Vj (joined VJ segment specific to TCR µ chain), and one C, are found in the koala; two sets are likely functional with all segments containing an intact open reading frame. c Koala with healthy left eye while right eye displays clinical signs of chronic active chlamydial keratoconjunctivitis. d
Distribution of upregulated genes in diseased koalas mapping to
‘GO:0002376 Immune System Process’ annotated at the CateGOrizer.
a-b
Depiction of koala population demographic history inferred using the
PSMC method from the diploid sequences of three koalas (a generation
time of 7 years was assumed). We applied the midpoint of the mutation
rate estimate for either a, human (1.45×10⁻⁸ mutations per site per generation) or b, mouse (5.4×10⁻⁹ mutations per site per generation). c
Depiction of koala population demographic history for each individual
koala (Pacific Chocolate, Bilbo, and Birke). A generation time of 7
years and a mutation rate of 1.45×10⁻⁸ mutations per site per generation was assumed. PSMC analyses were performed using the 'optimal' settings described in Fig. 3 of the main text, as well as using alternative values for the number of free atomic time intervals (p=44, 54, or 74), initial value of rho (ρ=2, 5, or 10), and the maximum time to the most recent common ancestor (t=10 or 20).
Trees
of codons under selection. Zip-compressed folder containing 70 pdf
documents, each illustrating the evidence for positive selection
distributed across the cytochrome P450 tree, as generated using the MEME39 method on Datamonkey35.
Gene
Ortholog list. These groups include the 1:1 orthologs and also the
genes families. For clarity, a pattern has been ascribed to each group
(1: single gene, m: multiple species, 0: absent).
De
novo and Mars summary statistics for ChIP-seq. Tables showing the
results of testing if the mean value for each repeat is significantly
different between the regions defined by the ChIP-seq experiments and
the whole genome. The table includes the number of observations for each
repeat in each region and the unadjusted P-value for the
Kolmogorov–Smirnov test and Anderson–Darling test are reported for when
values are continuous (KS.boot.p.value / AD.Cont.p.value) and
discontinuous (KS.p.value / AD.Disc.p.value). Yellow highlights are the
repeats that demarcate CENP-A peaks specifically.
MEME
output by codon and by branch. Excel spreadsheet containing full
by-codon and by-branch output from MEME analysis of 152 cytochrome P450
sequences.
List
of annotated genes involved in koala lactation. Key milk proteins that
form a major part of the protein content of milk across mammalian
species have been identified in the koala genome, mammary transcriptome
and milk proteomes. This includes proteins involved in nutrition and
transport such as caseins, β-lactoglobulin, α-lactalbumin and
lactotransferrin. While duplications are seen within the three casein
families (α, κ and β) in the monotreme and eutherian lineage, in the
koala genome, like other marsupials investigated, only single copies of
each casein gene were identified. Milk-expressed lipocalins were
clustered together and linked to a large number of other lipocalin
genes. The genomic location of two marsupial-specific novel milk
proteins (VELP and MM1) was also identified.
Open Access
This article is licensed under a Creative Commons Attribution 4.0
International License, which permits use, sharing, adaptation,
distribution and reproduction in any medium or format, as long as you
give appropriate credit to the original author(s) and the source,
provide a link to the Creative Commons license, and indicate if changes
were made. The images or other third party material in this article are
included in the article’s Creative Commons license, unless indicated
otherwise in a credit line to the material. If material is not included
in the article’s Creative Commons license and your intended use is not
permitted by statutory regulation or exceeds the permitted use, you will
need to obtain permission directly from the copyright holder. To view a
copy of this license, visit http://creativecommons.org/licenses/by/4.0/.