Mostrando postagens com marcador temperatura. Mostrar todas as postagens

quinta-feira, 23 de maio de 2019

Paleobotanist Scott Wing stands in wintry Wyoming badlands, where alligators swam 56 million years ago.
IRA BLOCK

A 500-million-year survey of Earth's climate reveals dire warning for humanity

Uma pesquisa de 500 milhões de anos do clima da Terra revela um aviso terrível para a humanidade

When it opens next month, the revamped fossil hall of the Smithsonian Institution's National Museum of Natural History in Washington, D.C., will be more than a vault of dinosaur bones. It will show how Earth's climate has shifted over the eons, driving radical changes in life, and how, in the modern age, one form of life—humans—is, in turn, transforming the climate.

To tell that story, Scott Wing and Brian Huber, a paleobotanist and paleontologist, respectively, at the museum, wanted to chart swings in Earth's average surface temperature over the past 500 million years or so. The two researchers also thought a temperature curve could counter climate contrarians' claim that global warming is no concern because Earth was much hotter millions of years ago. Wing and Huber wanted to show the reality of ancient temperature extremes—and how rapid shifts between them have led to mass extinctions. Abrupt climate changes, Wing says, "have catastrophic side effects that are really hard to adapt to."

But actually making the chart was unexpectedly challenging—and triggered a major effort to reconstruct the record. Although far from complete, the research is already showing that some ancient climates were even more extreme than was thought.

Ancient glaciations are easy enough to trace, as are hothouse periods when palms grew near the poles. But otherwise little is certain, especially early in the Phanerozoic, which spans the past 541 million years. Paleoclimate scientists study their own slices of time and use their own specialized temperature proxies—leaf shape, say, or growth bands in fossilized corals—which often conflict. "We don't talk to each other all that much," says Dana Royer, a paleoclimatologist at Wesleyan University in Middletown, Connecticut. So at a meeting last year, Wing and Huber assembled a loose-knit collaboration, dubbed Phantastic, dedicated to putting together a rigorous record. "Most people came away quite inspired to do something about this," says Dan Lunt, a paleoclimate modeler at the University of Bristol in the United Kingdom.

The value of a deep-time temperature curve extends beyond the exhibit. Similar curves exist for atmospheric carbon dioxide (CO2). Combine the two and you can see how much warming CO2 caused in the past, says Jessica Tierney, a paleoclimatologist at the University of Arizona in Tucson. Because the latest climate models seem to forecast more warming than earlier ones, "using paleoclimate to constrain the models is becoming much more important," she says. "We feel we have to step up."

Fever line

A preliminary global temperature curve shows that marine life diversified in extreme heat (1) before land-based plants absorbed carbon dioxide (CO2) and polar ice caps formed (2). Volcanoes and erosion swung CO2 levels up and down (3), but mammals evolved in a warm period (4). Now, humans are rapidly warming the climate again (5).
500 Millions of years ago 10˚ 15.5˚ 21.1˚ 26.7˚ 32.2˚C 50˚ 60˚ 70˚ 80˚ 90˚F 450 400 350 300 250 200 150 100 50 Today World without polar caps World with polar caps 2 3 5 4
1
SMITHSONIAN INSTITUTION NATIONAL MUSEUM OF NATURAL HISTORY, ADAPTED BY N. DESAI/SCIENCE
But ancient global temperatures are elusive because they varied with location and season, and because the gauges drop away as you move deeper in time: Tree rings go back only thousands of years and ice cores only a million years or so. Still, oxygen isotopes in tiny fossilized shells on the ocean floor give a fairly reliable longer-term record. Because water molecules with lighter oxygen variants evaporate faster and end up locked in ice sheets, the ratio of light to heavy isotopes in the fossils indicates the volume of global ice, a rough guide to temperatures.

However, ocean floor older than 100 million years or so is scarce, devoured by the constant churn of plate tectonics. To go deeper in time, Ethan Grossman, a geochemist at Texas A&M University in College Station, looks for marine fossils found on land—mostly teeth and extinct bivalves called brachiopods. They tend to be from the shallow, isolated seas that formed inside ancient supercontinents. To glean temperatures from those fossils, scientists have to assume those seas had a balance of oxygen isotopes similar to the ocean today.

Este "problema da água" tem décadas. Mas cientistas em Phantastic estão atacando-o com um segundo termômetro, baseado em uma nova técnica, chamada isótopos aglomerados, que mede a abundância de dois ou mais isótopos raros. Usando espectrômetros de massa sensíveis, eles analisam as cascas fósseis de moléculas de carbonato que contêm um isótopo pesado de oxigênio ligado a um carbono pesado, que se forma mais frequentemente a temperaturas mais baixas. Os resultados serão enganosos se o fóssil tiver sido exposto ao calor e à pressão durante o seu enterro, mas os pesquisadores aprenderam como identificar espécimes alterados. "Nós nos mudamos para o lugar onde podemos aplicá-lo", diz Kristin Bergmann, geobióloga do Instituto de Tecnologia de Massachusetts, em Cambridge, que está usando isótopos agregados para preparar um registro de temperatura dos últimos bilhões de anos.

In collaboration with Gregory Henkes, a geochemist at the State University of New York in Stony Brook, and others, Grossman has gone through his samples, tossing out those that show signs of alteration, and analyzed their clumped isotopes. The results match his existing oxygen-isotope measures, and they tell a startling story, he and Henkes reported last year in Earth & Planetary Science Letters. Some 450 million years ago, ocean waters averaged 35°C to 40°C, more than 20°C warmer than today. Yet marine life thrived, even diversified. "It's unsettling for the biologists, these warm temperatures we're proposing," Grossman says. "These are extreme for modern organisms."

To turn such data into a global temperature curve, researchers need to fill gaps in geography and time. One Phantastic collaborator, Christopher Scotese, a geologist at Northwestern University in Evanston, Illinois, has come up with a simple way to spread limited data into a global picture. He uses the presence of polar ice caps to indicate whether the world had a steep temperature differential between the equator and its poles.

Other collaborators are using the sparse data to calibrate computer simulations of the ancient climate, the way weather models use satellite data as a reality check. Lunt and Paul Valdes, also at Bristol, are ground-truthing a suite of several hundred paleoclimate simulations. They've been able to extrapolate temperatures across the planet for broad stretches of the Phanerozoic.

Although Wing and Huber are pleased with the work they've seeded, they also ran out of time. The temperature curve they're presenting at the museum opening is a beta, Wing says. "It's sort of jamming together different kinds of observations, different kinds of models, different kinds of procedures, and probably different assumptions." The plan is to replace it once the Phantastic team's efforts reach maturity. But even the draft version should open eyes, Grossman says. "This kind of work gives people a sense of how easy it is to tip into a warm period. Because the world has been warm."
Posted in:
doi:10.1126/science.aay1323

quinta-feira, 19 de abril de 2018

Great Barrier Reef saw huge losses from 2016 heatwave


Grande Barreira de Corais viu grandes perdas a 
partir da onda de calor de 2016

One-third of reefs in the world’s largest coral system were transformed by warmed waters, finds comprehensive underwater and aerial survey.

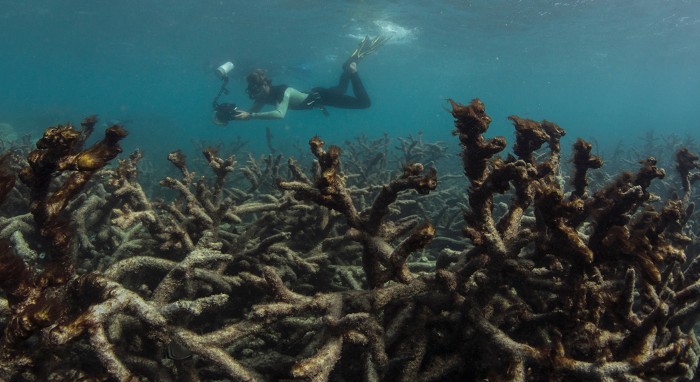
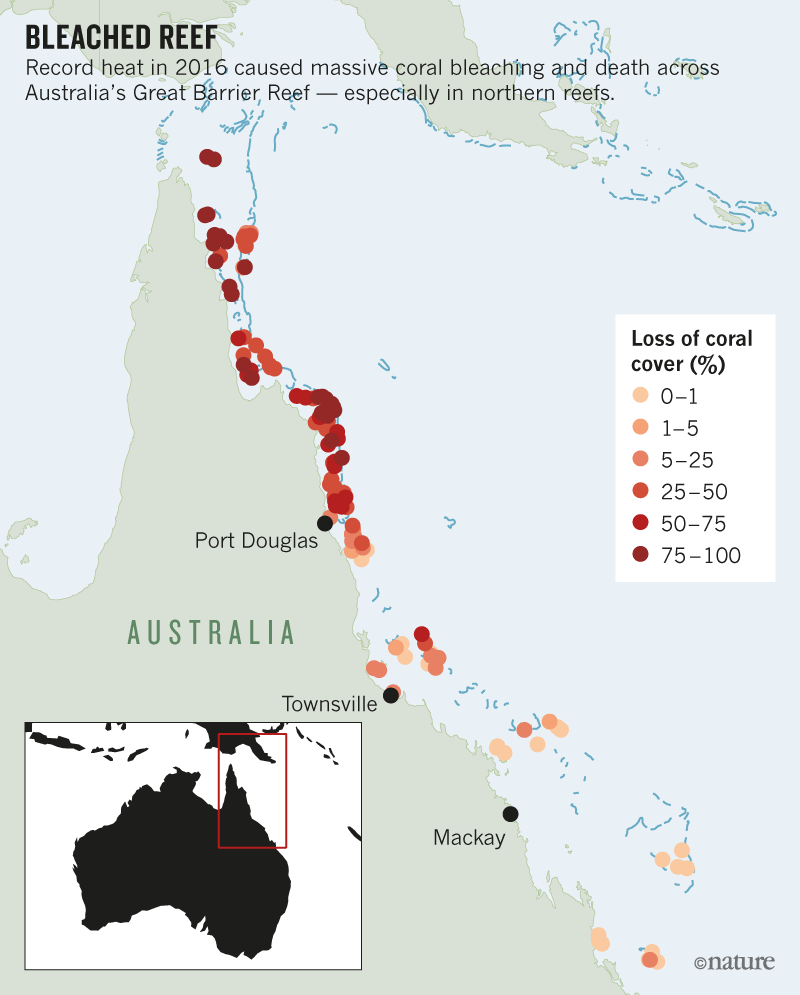
Extreme heat in 2016 damaged Australia’s Great Barrier Reef much more substantially than initial surveys indicated, according to ongoing studies that have tracked the health of the coral treasure. The heatwave caused massive bleaching of the corals that captured worldwide attention.

In a paper published on 18 April in Nature, researchers report1 that severe bleaching on an unprecedented scale triggered mass death of corals. This drastically changed the species composition of almost one-third of the 3,863 individual reefs that comprise the Great Barrier Reef.
The world’s largest coral reef is unlikely to recover soon. The damage is a harbinger of what a warming future might hold for a wealth of tropical reef ecosystems, says lead study author Terry Hughes, director of the coral-reef centre at James Cook University in Townsville, Australia. “If we fail to curb climate change, and global temperatures rise far above 2 °C [above the pre-industrial level], we will lose the benefits they provide to hundreds of millions of people.”

Fatal loss

Hughes and his team of ecologists closely examined the 2,300-kilometre Great Barrier Reef after the 2016 heatwave. Extensive aerial surveys revealed widespread coral bleaching between March and April 2016. This phenomenon occurs when excessive heat kills or expels algae called zooxanthellae, which have a symbiotic relationship with reef-building corals. The algae provide the corals with energy and nutrients from photosynthesis; without them, the corals often die.
But to gauge the full extent of heat damage, Hughes’s team conducted more-comprehensive underwater surveys of coral mortality, both at the peak of the observed bleaching in March and April, and again eight months later.

Many corals — especially those in the northern third of the reef — died immediately from heat stress. Others were killed more slowly, after their algal partners were expelled. The composition of coral assemblages on hundreds of individual reefs changed radically within just a few months of the heatwave. On severely bleached reefs, fast-growing coral species — which have complex shapes that provide important habitats — were replaced by slower-growing groups that shelter fewer sea creatures.
Source: Ref. 1
“The study paints a bleak picture of the sheer extent of coral loss on the Great Barrier Reef,” says Nick Graham, a marine ecologist at Lancaster University, UK. Approximately one-third of the world’s coral reefs were affected by bleaching in 2016. On the Great Barrier Reef, less than 10% of reefs escaped with no bleaching, compared with more than 40% in previous bleaching events.
“It is now critical to understand how governance and local management can maximize recovery between recurrent heatwaves,” Graham says.
Global impact
Tim McClanahan, a conservation zoologist at the Wildlife Conservation Society in Mombasa, Kenya, says the study’s findings might not predict how other reefs will cope with a warmer world. Responses might depend on the corals’ life histories and local environmental conditions. “Global warming will result in more heat-stress events,” he says, but “there is accumulating evidence that corals do acclimate”.
Global coral bleaching had been observed just twice, in 1998 and 2002, before the extreme 2016 incident. Coral colonies can recover from such events, especially given that the species most susceptible to dying from heat stress are among the fastest-growing corals. But harmful warming events are occurring more frequently, and scientists think that full recovery is becoming increasingly difficult2.
Researchers have also found that local protection of reefs and surrounding waters does little to make corals less sensitive to heat3. Rather, global changes such as ocean acidification might further increase environmental stress.
The fate of tropical coral reefs — including the iconic Great Barrier Reef — therefore depends on efforts to mitigate climate change, says Graham. “A future with coral reefs, their rich diversity and the livelihoods they provide to people is quite simple. It will only be possible if carbon emissions are rapidly reduced,” he says.
But even if that happens, tomorrow’s reefs might look different from today’s, as the mix of species changes in favour of those that can best cope with inevitable climate change, says Hughes. “This transition is already under way, faster than many of us expected,” he says. “The Great Barrier is shifting radically, a trend that will continue for the next century or more.”
Nature 556, 281-282 (2018)
doi: 10.1038/d41586-018-04660-w

terça-feira, 23 de agosto de 2016

Temperatura no centro da Terra chega a 6.000 graus Celsius

Estimativa supera em mil graus cálculos de experimentos anteriores

Por: Marcus V. Cabral - atualizado em 23/08/2016

Pesquisadores conseguiram determinar que a temperatura da Terra perto de seu centro é de 6.000 graus Celsius, mil graus mais quente do que experimentos anteriores haviam mostrado. Esses cálculos também confirmam modelos geofísicos que previam que, para explicar a formação do campo magnético terrestre, a diferença entre a temperatura do núcleo e do manto terrestre deveria ser de 1.500 graus. O resultado foi publicado nesta quinta-feira na revista Science.
CONHEÇA A PESQUISA

Título original: Melting of Iron at Earth’s Inner Core Boundary Based on Fast X-ray Diffraction

Onde foi divulgada: periódico Science
Quem fez: S. Anzellini, A. Dewaele, M. Mezouar, P. Loubeyre, G. Morard
Instituição: Comissão Francesa de Energia Atômica e Energias Alternativas
Dados de amostragem: Amostras de ferro, submetidas a diferentes valores de temperatura e pressão
Resultado: Os pesquisadores descobriram que, se submetido à pressão de 2,2 milhões de atmosferas, o ponto de fusão do ferro é de 4.8000 graus Celcius. Cálculos matemáticos mostraram que a temperatura do núcleo sólido do planeta, onde a pressão é de 3,3 milhões de atmosferas, pode chegar 6.000 graus.

O núcleo da Terra é formado, em sua maior parte, por uma esfera de ferro líquido com temperaturas superiores a 4.000 graus Celsius e pressão equivalente à de 1,3 milhão de atmosferas. Sob essas condições, o ferro se torna tão líquido quanto a água dos oceanos. É apenas no centro dessa esfera, onde as temperaturas e pressão são ainda maiores, que o ferro volta a se solidificar.

Os pesquisadores conhecem a maior parte dessas características a partir da análise do movimento das ondas sísmicas – causadas por terremotos – entre essas camadas. Essas ondas, no entanto, não são capazes de mostrar a temperatura nessas regiões, o que deixa de fora informações importantes para os cientistas compreenderem os movimentos dos materiais que compõem o centro da Terra. Por exemplo, a diferença entre as temperaturas do núcleo e do manto é um dos fatores responsáveis, junto com a rotação do planeta, por gerar o campo magnético da Terra.

Para descobrir a temperatura dessas camadas, os cientistas analisaram a temperatura de fusão do ferro em diferentes pressões, usando equipamentos feitos de diamante para comprimir pequenas partículas de ferro a pressões que são milhões de vezes superiores à exercida pela atmosfera. Nessas condições, os pesquisadores dispararam poderosos raios laser nas amostras, que são capazes de esquentar o material a até quase 5.000 graus Celsius. “Na prática, tivemos de superar muitos desafios experimentais, uma vez que as amostras precisam ser termicamente isoladas e não podem interagir quimicamente com o ambiente. Além disso, mesmo que uma amostra alcance temperatura e pressão extremas como as do centro da Terra, isso só vai acontecer por alguns segundos – período muito curto para determinar se o material começou a derreter ou continua sólido”, Agnès Dewaele, pesquisadora da Comissão Francesa de Energia Atômica e Energias Alternativas, responsável pela pesquisa.
ESRF
Temperatura
A fim de superar esse problema, os pesquisadores utilizaram raios-X como ferramenta para analisar as amostras de ferro. “Nós desenvolvemos uma nova técnica onde raios-X intensos podem atingir uma amostra e deduzir se ela está sólida, liquida ou parcialmente derretida, em períodos curtos de tempo, de até um segundo. Isso é rápido o suficiente para que a temperatura e pressão das amostras sejam mantidas constantes”, disse Mohamed Mezouar, pesquisador do Laboratório Europeu de Radiação Síncrotron, um dos autores do estudo.

Assim, eles conseguiram determinar experimentalmente que o ponto de fusão do ferro é de 4.800 graus a uma pressão de 2,2 milhões de atmosferas – os limites do equipamento. Utilizando modelos matemáticos, os pesquisadores calcularam o mesmo ponto de fusão para uma pressão de 3,3 milhões de atmosferas, equivalente à sentida na fronteira entre o núcleo sólido e o liquido. O resultado foi 6.000 graus Celsius.
Saiba mais:
Saiba mais: Missão quer chegar até o centro da Terra em 2020
Os pesquisadores também descobriram por que as pesquisas anteriores haviam calculado essa temperatura de forma errada. Segundo os cientistas, a partir dos 2.400 graus, um processo químico conhecido como recristalização acontece na superfície do ferro, levando a mudanças em sua estrutura. A pesquisa anterior havia usado técnicas ópticas para determinar se as amostras estavam sólidas ou líquidas, e é possível que os pesquisadores tenham interpretado a recristalização na superfície da amostra como um sinal de seu derretimento.

Saiba mais

CROSTA
Parte mais externa do planeta, pode medir até 60 quilômetros

MANTO
Camada densa feita de rochas quentes e semissólidas. Mede quase 3.000 quilômetros

NÚCLEO EXTERNO
Camada líquida do núcleo, é composta principalmente de ferro e níquel

NÚCLEO INTERNO
Centro extremamente quente e sólido, formado por ferro e níq