Mostrando postagens com marcador genética humana. Mostrar todas as postagens

terça-feira, 17 de dezembro de 2024

Translator


As pessoas não são ervilhas – por que a educação genética precisa de uma revisão
As décadas de genética desatualizada ensinada na maioria das escolas dos EUA alimentam conceitos errados sobre raça e diversidade humana. Um antropólogo biológico clama por mudança.
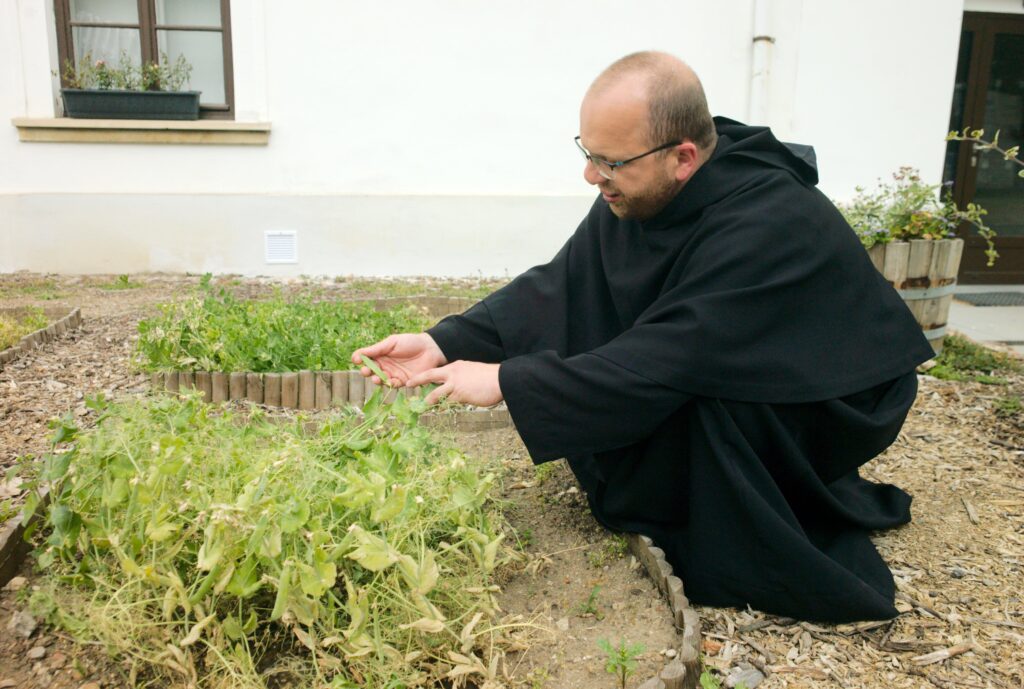
Uma pessoa vestindo uma túnica preta se agacha ao lado de um prédio branco para cuidar de um canteiro de ervilhas.

Os currículos de genética ainda se concentram frequentemente nas experiências de hereditariedade do padre austríaco do século XIX, Gregor Johann Mendel, com plantas de ervilha. O padre Jozef Rzonca está agachado no jardim onde Mendel conduziu sua famosa pesquisa.

Michael Heitmann/aliança de imagens/Getty Images

Em uma longa viagem de ônibus no início da década de 1970, o geneticista Richard Lewontin, da Universidade de Chicago , passou o tempo fazendo algumas contas novas.

Lewontin geralmente ficava no laboratório, estudando proteínas derivadas de moscas-das-frutas moídas. Como o DNA codifica proteínas, esta pesquisa abordou uma questão fundamental: até que ponto os indivíduos da mesma espécie variam geneticamente?

No ônibus, Lewontin voltou sua atenção para os humanos. Usando os dados disponíveis, ele calculou como as diferenças de proteínas eram mapeadas entre as pessoas ao redor do mundo. Ao contrário do que os cientistas presumiam na altura, ele descobriu que a maioria das diferenças existia em todas as populações – o que significa que a variação genética subjacente era partilhada por toda a humanidade, e não classificada por região geográfica ou categorias “raciais” predominantes.

Lewontin publicou os seus cálculos num breve artigo em 1972 que terminou com esta conclusão definitiva: “Uma vez que… a classificação racial é agora considerada como praticamente sem significado genético ou taxonómico, não pode ser apresentada qualquer justificação para a sua continuação.” Seus resultados foram replicados repetidas vezes ao longo dos últimos 50 anos, à medida que os conjuntos de dados aumentaram de um punhado de proteínas para centenas de milhares de genomas humanos.

But despite huge strides in genetics research—leaving no doubt about the validity of Lewontin’s conclusions—genetics curricula taught in U.S. secondary and post-secondary schools still largely reflect a pre-1970s view.

Este atraso nos currículos é mais do que uma preocupação para aqueles que estão na torre de marfim. Cada vez mais, a genómica desempenha um papel de liderança nos cuidados de saúde, na justiça criminal e no nosso sentido de identidade e ligação com os outros. Ao mesmo tempo, o racismo científico está a aumentar, atingindo mais pessoas do que nunca graças às redes sociais . A educação desatualizada não consegue dissipar esta desinformação.

Da genética básica ensinada nas escolas de ensino fundamental e médio aos cursos universitários, os currículos de biologia precisam desesperadamente de uma revisão.

COMO O DNA DIFERE

Sou um antropólogo biológico que usa dados genômicos para responder perguntas sobre a evolução dos primatas e dos seres humanos. Quando comecei os meus estudos de doutoramento, há uma década, ficámos a saber do artigo de Lewontin pelo seu significado histórico, mas as suas descobertas eram notícias antigas.

Antes de seus cálculos, muitos cientistas esperavam encontrar diferenças genéticas substanciais entre pessoas de diferentes regiões geográficas ou raças. Digamos que os povos indígenas na África carregariam o marcador A, mas todos os povos indígenas nas Américas teriam o marcador C.

Numa palestra de 2004, o geneticista evolucionista Richard Lewontin explica como quase toda a variação genética humana está contida entre indivíduos de qualquer população local. Ele também enfatiza que as migrações, invasões e misturas entre pessoas ao longo da história humana impediram fronteiras “raciais” claras.

Televisão da Universidade da Califórnia

Lewontin encontrou um resultado bastante diferente: a grande maioria (mais de 85%) das diferenças genéticas existia entre indivíduos da mesma região geográfica. Isso equivale a alguns povos indígenas na África e alguns povos indígenas nas Américas carregando a letra A do DNA (base molecular), enquanto outros africanos e povos indígenas nas Américas carregam a letra C. A maior parte da variação genética humana é compartilhada por todos os continentes – ou os grupos raciais inventados durante e desde a expansão colonial europeia.

Cálculos equivalentes feitos ao longo das últimas duas décadas – com base em dados do genoma de milhares de indivíduos – chegaram à mesma conclusão : existe uma elevada variação genética dentro das regiões geográficas e pouca variação distingue as regiões geográficas.

As variantes genéticas mais comuns, ou seja, transportadas por mais de 5% dos humanos, aparecem em todos os continentes. Apenas uma pequena parte destas variantes é encontrada exclusivamente num continente, e essas variantes específicas do continente tendem a ser raras entre os membros de uma população onde são encontradas.

INFORMAÇÕES GENÔMICAS

Além dos genomas de humanos vivos, o DNA extraído de humanos antigos nas últimas duas décadas revelou insights incríveis. Ao longo do tempo, os humanos do passado migraram frequentemente , acasalaram-se ou deslocaram pessoas que encontraram noutras regiões – resultando numa árvore emaranhada de ascendência humana. Os antigos resultados do DNA refutam qualquer noção de raízes profundas e separadas para humanos em diferentes regiões geográficas.

Além disso, os investigadores contemporâneos compreendem melhor como a variação do ADN contribui para as diferenças nas características humanas . Os cientistas sabem agora que a maioria dos nossos atributos biológicos são influenciados por muitas variantes genéticas e os seus efeitos variam em resposta a diversos fatores ambientais. Por exemplo, milhares de variantes genéticas influenciam a altura e o seu efeito é modificado pela nutrição infantil e pelas infecções.

Quanto à raça, os investigadores demonstraram conclusivamente que as categorias raciais históricas não se baseiam em nenhum aspecto inerente à nossa biologia. Mas isso não significa que estas categorias raciais e a biologia não afetem as experiências vividas pelas pessoas.
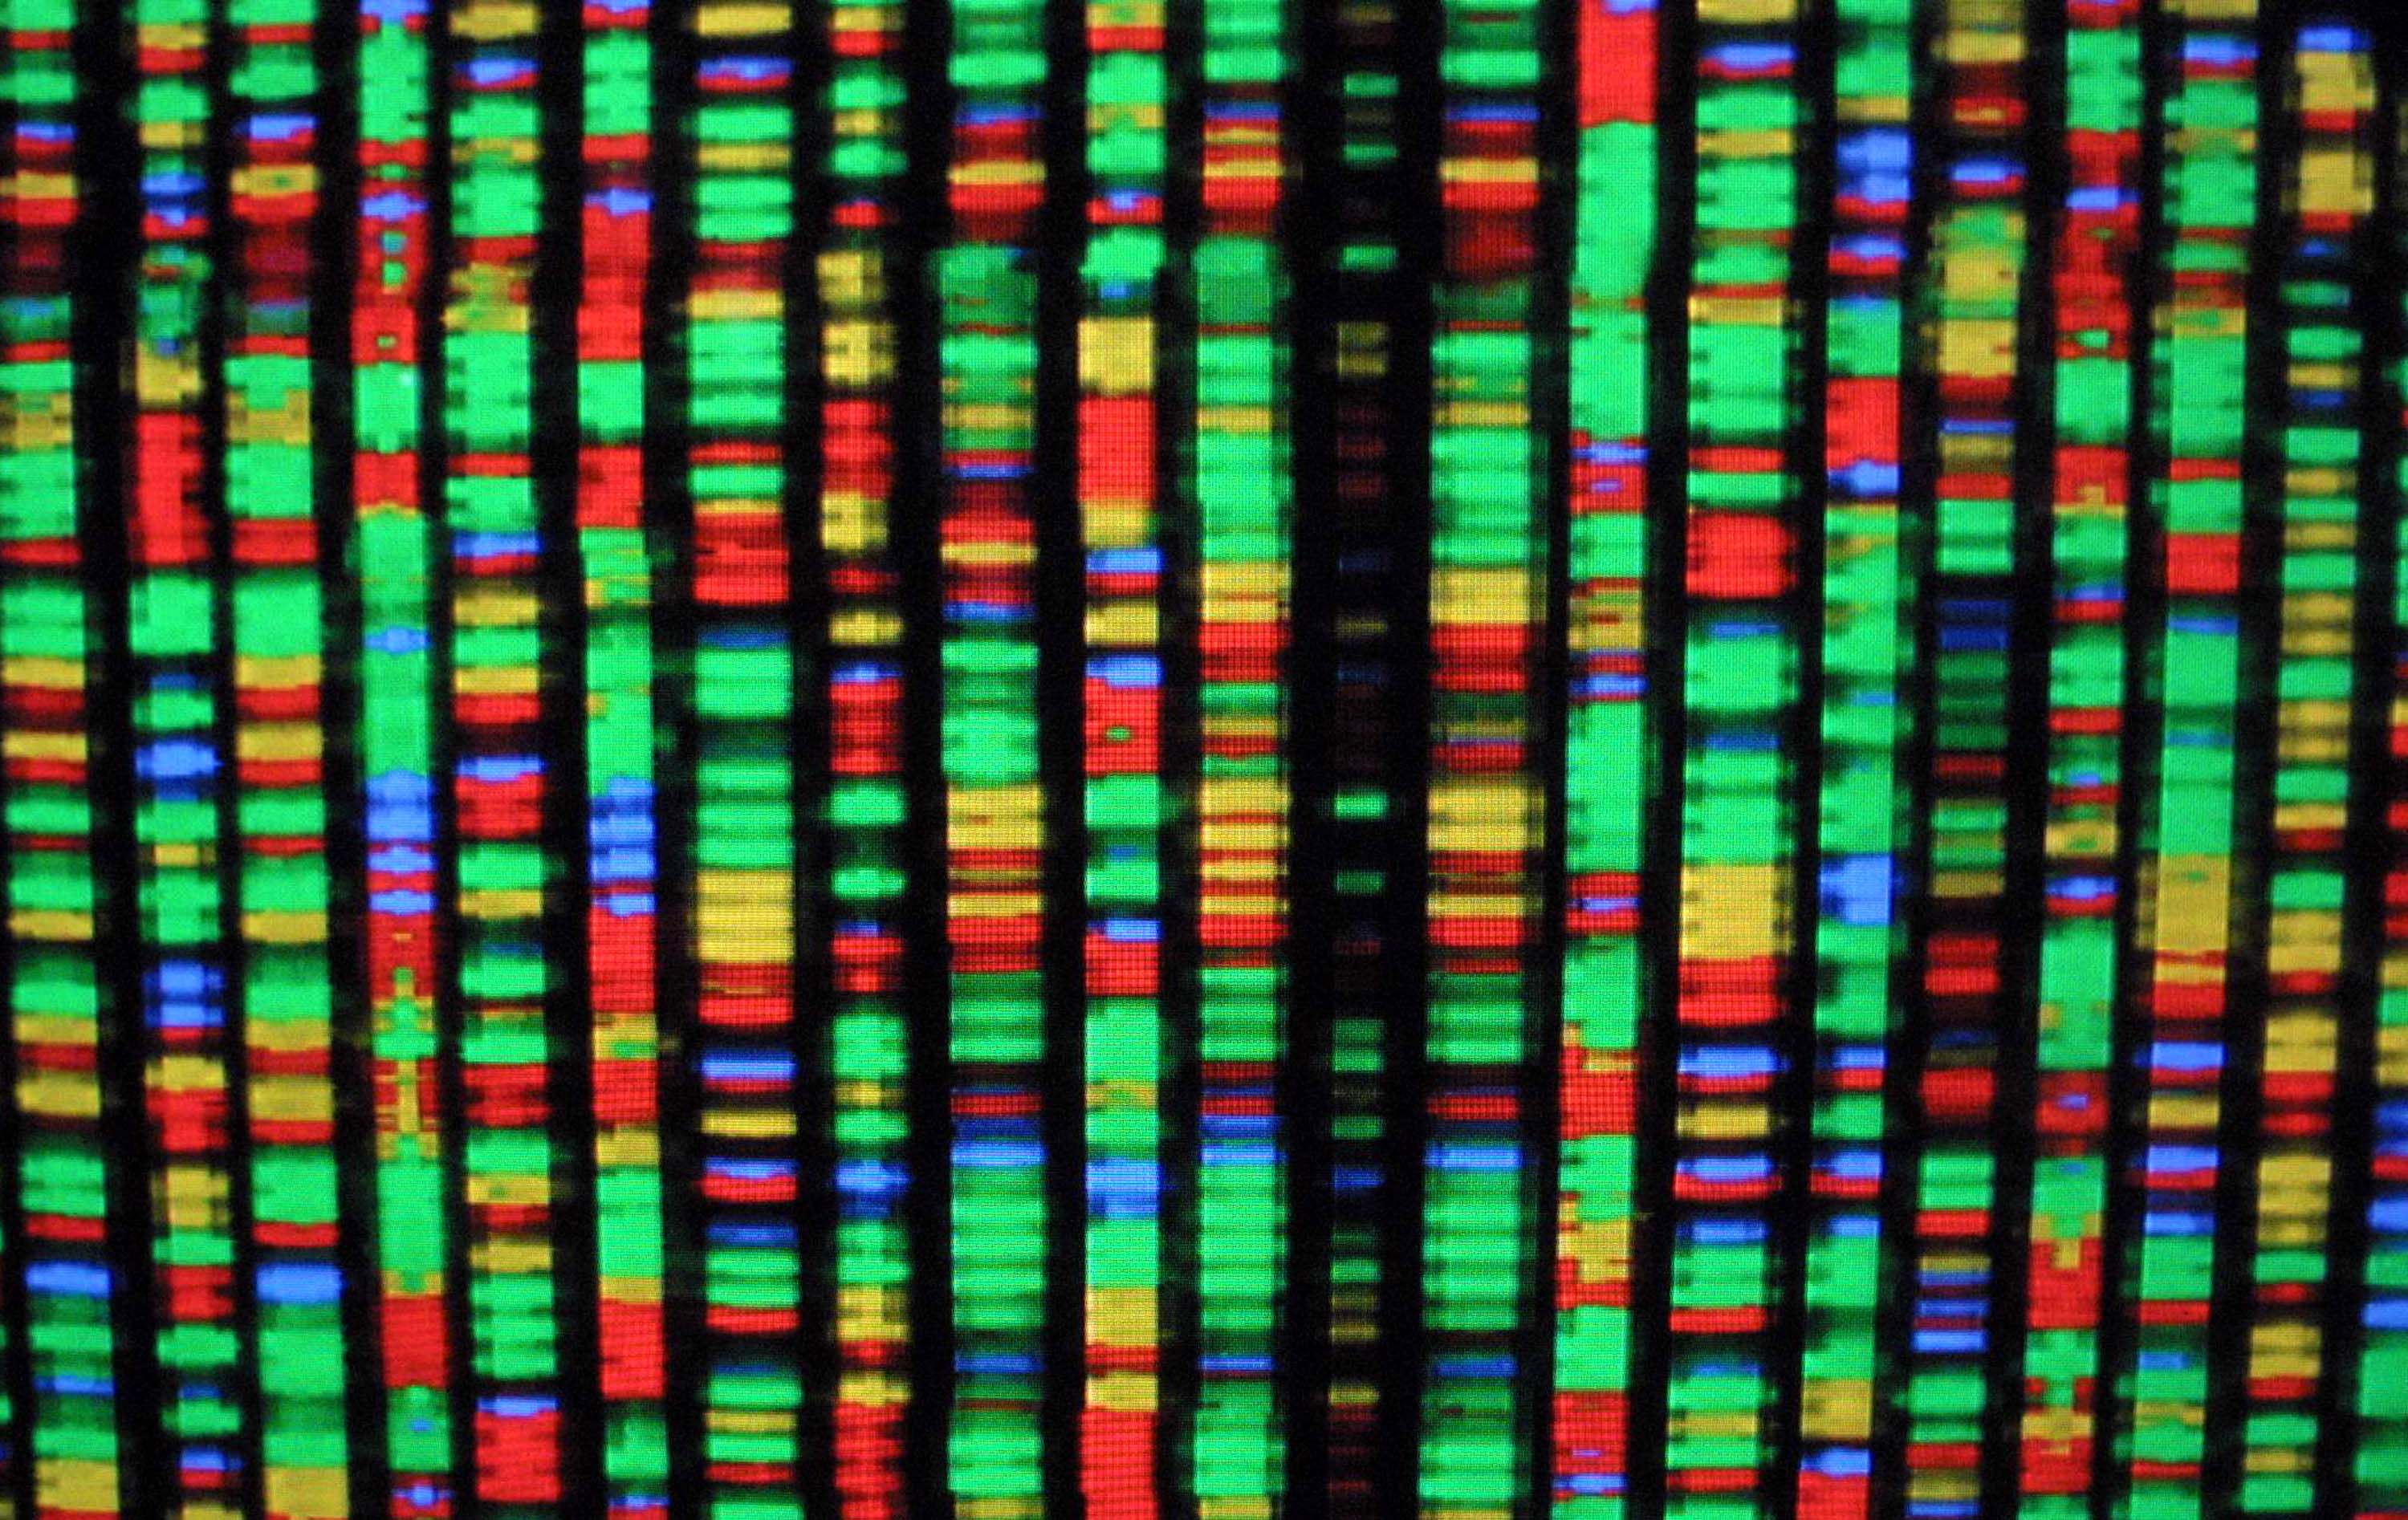
Uma tela preta exibe colunas estreitas compostas por pequenas listras vermelhas, verdes, azuis e amarelas.

No Museu Americano de História Natural, uma representação digital do genoma humano de 2001 apresenta codificação de cores para os quatro componentes químicos do DNA.

Mário Tama/Getty Images

Conforme estabelecido por uma importante associação profissional de antropólogos biológicos , a raça é uma social realidade que afeta a nossa biologia. Nas últimas centenas de anos, nos EUA e noutros países colonizados, o racismo influenciou o acesso das pessoas a alimentos nutritivos, educação, oportunidades econômicas, cuidados de saúde, segurança e muito mais. Como consequência, e precisamente devido à influência ambiental na maioria das características, a construção social da raça é um fator de risco para muitas condições e resultados de saúde, incluindo mortalidade materna e infantil , asma e gravidade da COVID-19 .

Médicos e pesquisadores estão reconhecendo cada vez mais que as disparidades raciais na saúde são resultado do racismo e não de diferenças raciais inatas.

LIÇÕES DE ATRASO

Quando comecei a lecionar na Duke University, há cinco anos, presumi que a maioria dos estudantes universitários teria recebido uma educação básica em genética – uma educação que refletisse actualizações fundamentais na investigação genética ao longo dos últimos 50 anos.

Não é assim. Rapidamente aprendi que a maioria dos alunos de graduação em minhas aulas ainda mantém a crença pré-Lewontin de que a variação genética humana se classifica predominantemente geograficamente. Muitos estudantes também pensavam que a raça se baseava em diferenças genéticas e que mutações únicas poderiam explicar características complexas nos seres humanos, como o risco para a maioria das doenças.

Duvido que os alunos das minhas aulas fossem únicos. Estudos mostraram que apresentações inconsistentes e a-históricas da genética provavelmente contribuem para a confusão dos estudantes sobre a natureza dos genes e seu papel em nossas vidas.

Os livros escolares padrão dos EUA dão pouca atenção à variação biológica humana. Em vez disso, a maioria dos livros concentra-se em tópicos como Gregor Mendel , o padre austríaco do século XIX que derivou “leis” de herança a partir do rastreamento de características observáveis ​​ao cruzar variedades de ervilhas. (Lembra daqueles quadrados de Punnett com ervilhas verdes e amarelas, ou enrugados e redondos?)
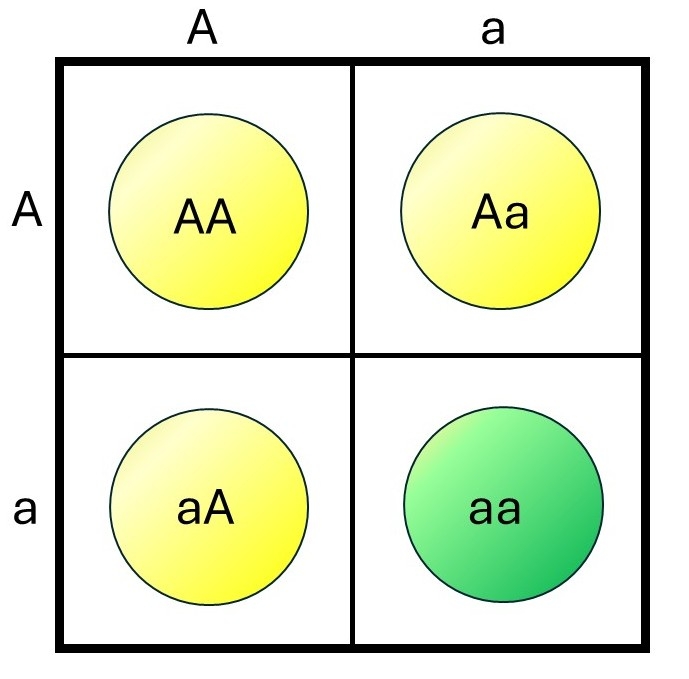
Um quadrado mostra quatro quadrados dentro dos quais há ilustrações de três ervilhas amarelas e uma ervilha verde.

O quadrado de Punnett mostra três possíveis genótipos que poderiam resultar do cruzamento de ervilhas verdes e amarelas: AA, Aa/aA, aa. Os genótipos AA e Aa/aA resultarão no fenótipo da ervilha amarela porque A é dominante. Somente aa produzirá o fenótipo da ervilha verde.

SAPIENS

Eu, juntamente com outros, estamos preocupados com o facto de este foco incutir e reforçar uma falsa visão pré-Lewontin de que os humanos, tal como as ervilhas de Mendel, vêm em tipos distintos. Na realidade, os primeiros estudos de ervilhas e outras espécies domesticadas e consanguíneas têm pouca relevância para a genética humana.

E quando as aulas do ensino secundário , superior e da faculdade de medicina nos EUA cobrem a diversidade humana, as lições centram-se principalmente na prevalência de doenças – e estão repletas de terminologia racializada. Por exemplo, os alunos aprendem frequentemente que a anemia falciforme afeta principalmente os afro-americanos. Mas a anemia falciforme não é exclusiva nem característica das pessoas com ascendência africana. Em vez disso, a variante genética que causa as células falciformes ocorre mais frequentemente em pessoas com ascendência recente em partes de África, Europa e Sul da Ásia – regiões onde a malária é ou foi recentemente endêmica.

Essa distinção pode parecer uma confusão. Mas acontece que tais distinções têm consequências.

Acadêmicos como o biólogo e educador Brian Donovan testaram como esses exemplos simplificados influenciam o pensamento dos alunos. Em vários estudos , ele comparou salas de aula que usavam livros didáticos padrão com aquelas que incorporavam conteúdo mais atualizado e preciso sobre a variação biológica humana. Os alunos que receberam a típica e desatualizada educação genética eram mais propensos a pensar que a raça é inerentemente biológica e que as diferenças genéticas entre as raças explicam as diferenças nos resultados da vida. O material desatualizado também diminuiu o apoio dos estudantes aos esforços destinados a corrigir a desigualdade racial.

Por outro lado, essa investigação também mostrou que estas medidas são revertidas por conteúdos que incluem a distribuição global da maior parte da variação genética e a base complexa e multifactorial da maioria das características humanas.

Os educadores podem perpetuar ou dissipar conceitos errados, dependendo de como ensinam genética.

DESTRUINDO UMA IDEIA ZOMBI

Considero a noção de que as categorias raciais históricas são baseadas na biologia uma “ ideia zumbi ”, uma ideia que reanima perpetuamente apesar das repetidas falsificações empíricas. As ideias zombies de raça biológica provavelmente persistem quando pontos de vista profundamente arraigados, particularmente aqueles importantes para as nossas identidades sociais, minam a avaliação racional das evidências. Como resultado, alguns argumentaram que é inútil combater o racismo com provas científicas.

Para ajudar o zumbi a persistir, os testes genéticos diretos ao consumidor , como os oferecidos pela 23andMe e pela AncestryDNA, podem reforçar conceitos errôneos sobre a variação humana. Esses serviços tornaram-se o principal ponto de referência de muitas pessoas para informações genéticas humanas. Para serem comercializáveis, as empresas devem comunicar os seus resultados de forma simples e familiar, que também pareçam significativas e fiáveis. Isso geralmente implica simplificar a ancestralidade genética para cores brilhantes e de alto contraste, fixadas definitivamente em regiões geográficas.

Uma caixa branca com as palavras “Serviço Genético Pessoal” e representações gráficas coloridas de genes está em uma prateleira.

Testes de genómica pessoal, como os do 23AndMe, dão a ilusão de precisão na identificação da linhagem genética de uma pessoa em regiões específicas do globo – mas a história real é muito mais complexa.

Smith Collection/Gado/Getty Images

Mesmo assim, a investigação de Donovan e outros sugere que é possível enfraquecer este zombie: chegar aos jovens através dos currículos de biologia pode alterar a sua visão sobre a raça e a variação humana.

No entanto, poucos livros didáticos de ensino médio e de graduação oferecem conteúdo atualizado. A genética da ervilha ainda ocupa as páginas. Adotar novos currículos, que complicam materiais que já são difíceis de ensinar, é assustador. A implementação de currículos de genética no ensino médio mais precisos exigirá o apoio de administradores escolares, pais e entidades como o College Board, que administra o exame de biologia Advanced Placement.

Entretanto, a integração generalizada da genética moderna nos cursos universitários é essencial. O ensino superior não tem o mesmo alcance do ensino fundamental e médio. Mas os instrutores universitários têm mais agilidade para ajustar o conteúdo do curso. Além disso, incutir conhecimentos atualizados em futuros professores secundários e médicos pode ter efeitos em cascata.

Essas mudanças não são fáceis, mas são possíveis e valem a pena. Além de impedir a propagação de visões de mundo racistas, a próxima geração estará mais bem informada sobre cuidados de saúde complicados e decisões reprodutivas. Currículos revisados ​​que não promovem implicitamente uma base biológica para categorias raciais históricas também têm menos probabilidade de alienar os estudantes de grupos sub-representados. Esta mudança poderia, por sua vez, aumentar a diversidade na força de trabalho científica, conduzindo a uma ciência melhor e mais saudável e a uma maior confiança entre os investigadores e o público.

Lewontin morreu aos 92 anos em 2021 . Seu trabalho foi fundamental para demonstrar que a raça não se baseia em diferenças genéticas. Muitos outros, como os geneticistas e comunicadores talentosos Joseph Graves Jr. , Charmaine Royal e Graham Coop , continuaram incansavelmente a carregar esta tocha.

Os educadores e as famílias podem ajudar exigindo que as suas escolas substituam os currículos centrados nas ervilhas do século XIX pela genética humana do século XXI.

quinta-feira, 8 de setembro de 2022

 6 DE SETEMBRO DE 2022

DNA antigo nos aproxima de desvendar segredos de como os humanos modernos evoluíram

DNA antigo nos aproxima de desvendar segredos de como os humanos modernos evoluíram
Os avanços na tecnologia de sequenciamento do genoma possibilitam aos cientistas comparar o DNA de pessoas vivas hoje com DNA extraído de esqueletos muito antigos. Crédito: © Julius Kielaitis, Shutterstock

Os avanços no estudo do DNA antigo de restos pré-históricos nos fornecem uma nova visão sobre a vida de nossos ancestrais africanos e o surgimento do humano moderno.

Todos os seres humanos compartilham uma ancestralidade africana comum, tornando a história africana a história de todos. No entanto, pouco se sabe sobre a evolução genética das pessoas que vivem no continente no passado distante.

Graças aos avanços na tecnologia de sequenciamento de genoma, os cientistas agora podem comparar o DNA de pessoas vivas hoje com DNA extraído de esqueletos muito antigos, dando-nos um instantâneo único da vida na África de muitos milhares de anos atrás.

No campo da genética humana, a história da Mãe Eva é familiar. Ele descreve como todos os seres humanos vivos descendem de uma mulher que viveu na África 200.000 a 300.000 anos atrás.

A evidência vem de estudos de DNA mitocondrial (mtDNA) – um segmento de material genético encontrado na célula humana. Entre outras coisas, permite o estudo de parentesco em populações. Como apenas as mães o transmitem, revela a linha evolutiva direta entre uma pessoa que vive hoje e sua ancestral feminina mais distante.

Eva mitocondrial

Mas, como a maioria das histórias simples, a história da Eva mitocondrial não é totalmente precisa nem completa. Embora os cientistas concordem que o surgimento dos humanos realmente ocorreu na África, Eva teria sido uma das muitas fêmeas humanas que viviam na época, e ela não teria sido a primeira.

Infelizmente, a realidade é que o mtDNA nos dá uma visão limitada sobre as linhas do tempo, ou os padrões, de disseminação e dispersão da população.

O biólogo molecular Dr. Mateja Hajdinjak explica o significado dessa lacuna de conhecimento. “A história da população africana moldou o mundo em que todos vivemos, então, até que possamos reconstruir os eventos do passado da África, remontando a milhares de anos, não podemos entender completamente como os humanos modernos surgiram”.

Dr. Hajdinjak é o pesquisador de pós-doutorado no projeto ORIGIN , uma iniciativa de pesquisa baseada no Francis Crick Institute em Londres, Reino Unido, que está analisando DNA de restos humanos encontrados em sítios arqueológicos na África.

O objetivo do ORIGIN é reconstruir a pré-história africana usando a análise de DNA antigo.

As informações obtidas a partir dessas amostras de DNA estão sendo estudadas juntamente com as descobertas dos arqueólogos, paleontólogos e curadores de museus do projeto.

Extratos de DNA

Dr. Hajdinjak está entre um número crescente de pesquisadores que trabalham arduamente para preencher as lacunas históricas, indo além da análise do mtDNA para usar as técnicas mais recentes no sequenciamento do genoma completo. Isso permite que os pesquisadores comparem o DNA das pessoas que vivem hoje com o DNA extraído de esqueletos muito antigos.

"Uma de nossas  é: como podemos usar DNA antigo para reconstruir migrações populacionais passadas na África e entre a África e outras partes do mundo?" disse o Dr. Hajdinjak.

Ela acrescenta que pouco se sabe sobre a paisagem genômica passada em toda a África, já que grande parte da  ocorreu no continente quando alguns grupos mudaram de seu modo de vida caçador-coletor para se tornarem agricultores entre 3.000 e 7.000 anos atrás.

"Ao comparar genomas passados, podemos ver como diferentes grupos humanos estão interconectados e como as migrações ocorreram em diferentes momentos da história. As migrações permitem que as pessoas se misturem e se reproduzam com novos grupos, o que muda a biologia humana ao longo do tempo."

Muito já se sabe sobre a história da Europa antiga graças às modernas técnicas de sequenciamento, mas os estudos de DNA antigos de amostras africanas ficaram para trás. A razão para isso é que o DNA se degrada com o tempo, e especialmente nos climas quentes e úmidos que prevalecem na África.

Enriquecimento do genoma

No entanto, graças a ferramentas de enriquecimento de genoma de ponta que permitem que o DNA dos menores fragmentos de osso ou dentes seja extraído e depois amplificado, os cientistas estão começando a fazer um bom progresso no sequenciamento de DNA antigo da África também.

Ao estudar os dados dessa maneira, os pesquisadores estão começando a reconstruir eventos do passado distante e a investigar as relações que surgiram entre diferentes populações africanas.

O objetivo do ORIGIN não é simplesmente satisfazer nossa curiosidade natural sobre de onde viemos, mas também desvendar a linha do tempo de nossa evolução genética e usar essas informações para prever como podemos evoluir no futuro.

Algumas  terão sido instantaneamente benéficas para nossos ancestrais africanos e persistirão através do pool genético até hoje, milhares de anos depois de terem surgido. Um exemplo-chave é a persistência da lactase – a capacidade de digerir o leite até a idade adulta.

Leite e produtos lácteos são uma valiosa fonte de energia, mas o estado ancestral padrão é a intolerância à lactose. Para os adultos que vivem nas primeiras comunidades agrícolas africanas, a capacidade de converter o leite de seus rebanhos em glicose pode ter dado a eles uma vantagem evolutiva sobre seus vizinhos intolerantes à lactose.

Mutação de células falciformes

Outra variante genética que teria impulsionado a sobrevivência humana quando surgiu pela primeira vez é a  . Esta variante genética confere um grau de proteção contra a malária.

No entanto, a mutação é uma espécie de faca de dois gumes, pois também é responsável pela doença das células falciformes – uma condição séria e duradoura que prevalece em partes da África até hoje.

"Seria muito importante reconstruir como as mutações das células falciformes apareceram e se espalharam", disse o Dr. Pontus Skoglund, supervisor do projeto ORIGIN.

“Ao entender quando as mutações aconteceram e como elas se espalham, podemos entender melhor como os humanos respondem aos desafios evolutivos”, disse Skoglund.

Mistura genética

Os pesquisadores envolvidos no projeto AfricanNeo, apoiado pela UE, estão particularmente intrigados com as primeiras práticas agrícolas na África. Eles estão comparando amostras de DNA antigo com DNA contemporâneo para refinar sua compreensão de quando as populações africanas começaram a migrar pelo continente.

Essas migrações tiveram um enorme impacto na mistura genética de grupos, mas os pesquisadores estão descobrindo que essa “expansão” foi uma série complexa de eventos que não podem ser encapsulados em uma narrativa mitocondrial no estilo Eva.

"A expansão não foi uniforme em todo o continente", disse a professora associada Carina Schlebusch. Ela é bióloga evolucionária da Universidade de Uppsala, na Suécia, e investigadora principal do projeto.

"Alguns grupos de caçadores-coletores foram substituídos por fazendeiros", disse ela, referindo-se à probabilidade de que o conflito surgisse entre populações que quisessem ocupar a mesma terra e que os fazendeiros tivessem uma vantagem competitiva sobre os caçadores-coletores. “Outros grupos interagiram e trocaram genes, e outros ainda permaneceram isolados por muito mais tempo do que você poderia esperar”.

Está claro por que todos devemos nos preocupar com esses eventos complexos do passado distante da África, de acordo com o Dr. Schlebusch.

"A história tende a se repetir", disse ela. "Esses eventos migratórios do passado podem desempenhar um papel em como nos comportamos em nosso futuro. Por exemplo, as mudanças climáticas significam que provavelmente haverá mais pressões sobre as pessoas que são forçadas a deixar suas casas. Há uma chance de haver mais conflitos entre as populações e que alguns grupos minoritários serão substituídos."

"Quanto mais aprendemos sobre nossa história", disse ela, "mais podemos prever como as coisas funcionarão no futuro".


Explorar mais


segunda-feira, 29 de abril de 2019

Baixa diversidade genética humana
 
Folha de São Paulo, novembro 2001

Análise detalhada do cromossomo humano 21 revela que a diversidade genética entre indivíduos é menor do que se imaginava, indica um estudo publicado hoje por cientistas da empresa de biotecnologia californiana Perlegen Sciences na revista "Science" (www.sciencemag.org).

O grupo de pesquisadores, liderado pelo geneticista David Cox, descobriu que uma boa parcela dos nucleotídeos ("letras" de DNA) que podem variar de um indivíduo para outro está trancada em grandes pacotes de DNA, que normalmente não se alteram no passar das gerações.

Além de ser um sinal de que grupos distintos podem ser menos diferentes do que se pensava, a leitura faz crescer a expectativa de que a comparação entre genomas possa ser usada com mais facilidade em pesquisas médicas. Pelo que os cientistas observaram, pode se tornar menos penosa a tarefa de comparar DNA para identificar genes importantes, como os que determinam predisposição para doenças ou resistência do organismo a medicamentos.

Os pesquisadores da Perlegen estudaram o cromossomo 21 em 20 indivíduos de várias etnias (entre negros, asiáticos e caucasianos).

No grupo analisado, os nucleotídeos que podem variar de um indivíduo para outro (os polimorfismos de nucleotídeo único, ou SNPs) estavam presos em pacotes maiores do que se imaginava, com menor variabilidade.

Esses pacotes são os chamados haplótipos, blocos de DNA transmitidos em conjunto para os descendentes. O haplótipo é um trecho do genoma que, em um único cromossomo de cada par, não pode ter partes da mãe e do pai juntas, apenas de um deles.

No cromossomo 21, "mais de 80% da amostra global humana pode ser tipicamente caracterizada por apenas três haplótipos comuns", escreve Cox no artigo. A humanidade não teria, assim, uma variedade de combinações tão grande, já que a maioria deles se situaria nesses blocos fixos.
Alguns cientistas vêem com ceticismo a constante e ininterrupta mudança de previsões sobre a quantidade de genes que compõem o genoma humano. Para a geneticista brasileira Mayana Zatz, do Instituto de Biociências da USP, pode ser perigoso generalizar as descobertas do cromossomo 21 para descrever aquilo que seria o genoma inteiro. "Não dá para extrapolar a partir de um único cromossomo", diz.

Dados genômicos de duas dezenas de indivíduos podem parecer pouco para representar um conjunto da população mundial, mas o estudo coordenado por Cox foi um dos mais abrangentes já feitos.Porém, mesmo somado a outros estudos realizados, o que se sabe sobre diversidade genética humana ainda é pouco.

"Conclusões mais abrangentes sobre as estruturas de haplótipos no genoma humano não podem ser tiradas com um grau alto de certeza porque o número de cromossomos analisados ainda é pequeno", escreve Kok.

quinta-feira, 17 de janeiro de 2019

Biparental Inheritance of Mitochondrial DNA in Humans

Shiyu Luo, C. Alexander Valencia, Jinglan Zhang, Ni-Chung Lee, Jesse Slone, Baoheng Gui, Xinjian Wang, Zhuo Li, Sarah Dell, Jenice Brown, Stella Maris Chen, Yin-Hsiu Chien, Wuh-Liang Hwu, Pi-Chuan Fan, Lee-Jun Wong, Paldeep S. Atwal, and Taosheng Huang
  1. Edited by Douglas C. Wallace, Children’s Hospital of Philadelphia and University of Philadelphia, Philadelphia, PA, and approved October 29, 2018 (received for review June 26, 2018)
This article requires a subscription to view the full text. If you have a subscription you may use the login form below to view the article. Access to this article can also be purchased.

Significance

The energy-producing organelle mitochondrion contains its own compact genome, which is separate from the nuclear genome. In nearly all mammals, this mitochondrial genome is inherited exclusively from the mother, and transmission of paternal mitochondria or mitochondrial DNA (mtDNA) has not been convincingly demonstrated in humans. In this paper, we have uncovered multiple instances of biparental inheritance of mtDNA spanning three unrelated multiple generation families, a result confirmed by independent sequencing across multiple unrelated laboratories with different methodologies. Surprisingly, this pattern of inheritance appears to be determined in an autosomal dominantlike manner. This paper profoundly alters a widespread belief about mitochondrial inheritance and potentially opens a novel field in mitochondrial medicine.

Abstract

Although there has been considerable debate about whether paternal mitochondrial DNA (mtDNA) transmission may coexist with maternal transmission of mtDNA, it is generally believed that mitochondria and mtDNA are exclusively maternally inherited in humans. Here, we identified three unrelated multigeneration families with a high level of mtDNA heteroplasmy (ranging from 24 to 76%) in a total of 17 individuals. Heteroplasmy of mtDNA was independently examined by high-depth whole mtDNA sequencing analysis in our research laboratory and in two Clinical Laboratory Improvement Amendments and College of American Pathologists-accredited laboratories using multiple approaches. 

A comprehensive exploration of mtDNA segregation in these families shows biparental mtDNA transmission with an autosomal dominantlike inheritance mode. Our results suggest that, although the central dogma of maternal inheritance of mtDNA remains valid, there are some exceptional cases where paternal mtDNA could be passed to the offspring. Elucidating the molecular mechanism for this unusual mode of inheritance will provide new insights into how mtDNA is passed on from parent to offspring and may even lead to the development of new avenues for the therapeutic treatment for pathogenic mtDNA transmission.

sexta-feira, 28 de setembro de 2018

Inferring Human Demographic Histories of Non-African Populations from Patterns of Allele Sharing

Estudos recentes de genética humana chegaram a conclusões diferentes sobre como e quando os humanos modernos se espalharam da África para o resto do mundo. Eu apresento aqui uma análise simples baseada em parcimônia que sugere que os asiáticos e melanésios orientais são grupos irmãos, e discuto quais implicações isso tem para alegações recentes feitas sobre as histórias demográficas de populações não africanas.

Introduction

Anatomically modern humans are thought to have evolved in sub-Saharan Africa 150,000–200,000 years ago
1
2
(150–200 Kya) and from there to have eventually colonized the rest of the world. It is unclear, though, how and when modern humans first left Africa and whether there was one major migration out of Africa or more than one. One theory, the “coastal migration model” (CMM), posits that the first modern humans to leave Africa departed from the Northeast through the Arabian peninsula, then along the coasts of India and Southeast Asia until they reached Australia roughly 50 Kya.
3
4
Descendants of this first wave of migration are hypothesized to include aboriginal Australians, Melanesians, and possibly so-called Negrito groups in South and Southeast Asia. Then, a second dispersal out of Africa led to the colonization of the rest of the world, including mainland Europe, Southeast Asia, and the Americas. The other major hypothesis posits that there was a single major migration out of Africa and that all extant non-African populations are descended from these first migrants.
5
6
(The focus on extant populations here excludes modern human groups that left no present-day descendants, cf. Fu et al., 2015 and Liu et al., 2015
7
8
). The evidence so far from early genetic studies and archeological studies has been mixed, and no clear scientific consensus has been reached.
6
9
From a genetic perspective, it is not always clear what predictions different models make. Researchers have focused instead on questions that are more easily answerable. Figure 1 shows two possible branching orders for West Africans, Europeans, East Asians, and Melanesians, as well as interpretations in terms of waves of migration out of Africa (OOA) and into Asia (I2A). With the recent proliferation of whole-genome sequence datasets from diverse populations, it should be easier to distinguish between these competing demographic models. Rasmussen and colleagues
published the genome of an aboriginal Australian individual and observed that this individual’s genome shows a greater divergence from African genomes than do genomes from mainland Eurasia. They interpreted this observation as evidence for the CMM and suggested that the greater divergence was due to an older separation time. However, this observation has an alternative explanation in light of the fact that aboriginal Australians (but not mainland Eurasians) have experienced a substantial amount of admixture from Denisovans.
In particular, the greater observed divergence could be due to the presence of introgressed Denisovan regions.
Figure thumbnail gr1
Figure 1Schematic of Two Different Potential Branching Orders for Major Non-African Populations
More recently, several large whole-genome sequencing studies have made conflicting claims regarding the historical branching order for the groups shown in Figure 1 (reviewed in Tucci and Akey, 2016 ). Specifically, Malaspinas et al. claimed that Melanesians are an outgroup in comparison to mainland Eurasians (i.e., Figure 1A), whereas Pagani et al. posited that Melanesians contain some ancestry from an older out-of-Africa migration (which we call “ghost” admixture) and implied (though did not state explicitly) that Figure 1A is the correct branching order (see, e.g., their Extended Data Figure 4A). In contrast Figures 1 and 3 in Mallick et al. suggested that Europeans are an outgroup in comparison to East Asians and Melanesians (i.e., Figure 1B). One difficulty in assessing the merits of these competing claims is that they are based on the output from complicated inference tools such as Fastsimcoal, MSMC or fineSTRUCTURE. Given the intricate nature of these methods, it is difficult to assess how sensitive they are to model assumptions and sampling biases or to determine whether they have been implemented correctly. In addition, both MSMC and fineSTRUCTURE require (haplotype) phased data, making them less reliable for analyses involving human populations not included in the HapMap or 1000 Genomes Projects.
In this study, I present a straightforward, easy-to-understand analysis of patterns of human genetic variation. Based on the phylogenetic concept of parsimony, this analysis can be thought of as an estimate of the average branch lengths, across the whole genome, of internal branches in the (unobserved) genealogies of sampled individuals, and it is similar to previously proposed approaches, such as D-statistics and the D4P statistic, for inferring branching orders and detecting admixture. The results reported here suggest that the true branching order of the major non-African populations is easy to recover, even with relatively unsophisticated analytical methods.

Material and Methods

Human Sequence Data

I started with the variant calls used in Pagani et al. (downloaded from the Estonian Biocenter website) and filtered them to consider only biallelic autosomal SNPs. I further considered only those variants where the reference allele was the ancestral allele and where the genotype was homozygous reference in 21 West and Central African (nine Yoruba, four Luhya, and eight Pygmy) genomes and in Neanderthal and Denisovan genomes. For each such variant, I then tabulated the frequency of the alternative allele across two test populations from Europe, East Asia, and Melanesia (i.e., Tuscan, Croat, Han, Japanese, Kosipe and Koinanbe).

Allele-Sharing Statistics

Suppose we have samples from a European, an East Asian, and a Melanesian population with sample sizes nE, nA, and nM, respectively. Then, for a set of S SNPs, we use ei, ai and mi to denote the number of copies of the derived allele at the i-th SNP in the European, East Asian, and Melanesian samples (0 ≤ ei ≤ 2nE, etc.). We then define KEA as follows:
Math Eq
The term in the summation is the probability that randomly chosen single alleles from each of the three non-African populations will yield a derived allele shared between the European and East Asian samples and an ancestral allele in the Melanesian sample. KEM and KAM are defined analogously. Note that it is straightforward to modify the denominator to handle missing data in any of the samples. Finally, we define PEA, PEM, and PAM as KEA/(KEA+KEM+KAM), KEM/(KEA+KEM+KAM), and KAM/(KEA+KEM+KAM), respectively. Using a parsimony assumption, these three values reflect the proportions of phylogenetically informative SNPs that support each of the three possible tree topologies (Figure 2, assuming the West and Central African samples described above are an outgroup). Although the true topologies are expected to vary across the genome due to incomplete lineage sorting and additional demographic factors not considered here (e.g., migration), the relative number of variants supporting each topology is informative about the average genealogical history of the samples and thus the true branching order of the populations. This same approach was used in some of the work that showed that chimpanzees (and bonobos) are our closest living relatives.
Figure thumbnail gr2
Figure 2Possible Genealogies for Non-African Populations
PEA, PEM, and PAM are similar to previously defined admixture-quantifying statistics, such as D-statistics, E-statistics, enhanced D-statistics, and the D4P statistic. All of these are counting statistics that condition on the presence or absence of derived alleles across individuals. For example, although enhanced D-statistics count sites that are homozygous ancestral in sub-Saharan Africans but derived in the Denisovan genome, the method introduced here counts variants that are homozygous ancestral in sub-Saharan Africans, Neanderthals, and Denisovans.

Simulations Using the Malaspinas et al. Model

I obtained the exact simulation parameters used for generating data under the model shown in Malaspinas et al.’s Figure S07.3 from Vitor Sousa. I then used these parameter values and the program ms0ancient2 to simulate sequence data. I assumed (diploid) sample sizes of 21, 3, 3, and 3 for the West African, European, East Asian, and Australian populations. ms0ancient2 is a simple modification of Hudson’s ms; it changes branch lengths to allow for the past sampling of two archaic genomes. To sample non-African sequences roughly 42 Kya, I shifted the scaled times of events by 0.032324 (I used the same time scaling as in Malaspinas et al. ). Both sets of simulations included a total of 2.05 Gb of simulated sequence to roughly approximate the total length of the genome that was available after filtering.

Simulations Modeled after Pagani et al.

I constructed five simple branching models (without migration) based on the split times described in Pagani et al. All models used a scaling of 2N generations = 1 million years and, when possible, assumed that the median genetic split times as estimated from MSMC are actual population split times. Models 1–3 are simple branching models (Figure 3A) with a split time between Europeans and East Asians of 30 Kya, a split time between Eurasians and Papuans of 40 Kya, and a split time between Eurasians and West Africans of 75 Kya. Papuans also derived 0%–5% of their ancestry from an unsampled “ghost” population that was completely isolated from 38–120 Kya. Models 1, 2, and 3 have 0%, 2%, and 5% “ghost” admixture, respectively. These models also assumed 4% admixture from Denisovans into Papuans 35 Kya, 2% Neanderthal admixture into non-Africans 65 Kya, an Altai Neanderthal sampling time of 130 Kya, a Denisovan sampling time of 100 Kya, an intra-Neanderthal split time of 150 Kya, an intra-Denisovan split time of 350 Kya, a Neanderthal-Denisovan split time of 425 Kya and an archaic-modern split time of 650 Kya. These parameter values, while somewhat arbitrary, were taken from the literature whenever possible.
Figure thumbnail gr3
Figure 3Schematics of Population Models Used for Simulations
I also tried to construct a model that followed a similar branching order as in Extended Data Figure from Pagani et al.16 (but without the West European hunter-gatherer population). Specifically, I assumed that the ancestral European population split 10 Kya into two groups (i.e., ANE and Basal European). One of these (ANE) merged with the ancestral East Asian population 30 Kya, whereas the other (Basal European) merged with the ancestral Melanesian–East-Asian population 45 Kya (Figure 3B). All other model parameters were assumed to be the same as above. Models 4 and 5 assumed a 20%–80% or an 80%–20% split of European ancestry into the ANE and Basal European groups, respectively.

Additional Simulations

I tested additional demographic models to better understand how specific parameter values affect the relative values of PEA, PEM, and PAM. These models were similar to the Pagani models 1–3 described above. One set of simulations took Pagani model 2 and added a single pulse of migration from the East Asian population into the Melanesian population 10–20 Kya (Figure 3C). This pulse accounted for 20%–90% of the subsequent Melanesian gene pool. The other set of simulations used the same population branching order as in Figure 1B, but with all other model parameters (e.g., Neanderthal and Denisovan admixture, “ghost” admixture, and African–non-African divergence time) being the same as in Pagani models 1–3. These simulations had East-Asian–Melanesian split times from 40–45 Kya and European–East-Asian split times of 50–60 Kya. For each parameter combination, we simulated 2.05 Gb of sequence and estimated PEM, PEA, and PAM. We also calculated these parameters on sites that conditioned on the homozygous reference allele in only the 21 sub-Saharan Africans and the Neanderthal, to see what effect the Denisovan conditioning had on the proportions.

Results

I focused on variants that were not present in sub-Saharan Africans or archaic humans and that are thus likely to have arisen after the dispersal of modern humans out of Africa. I also assumed that West Africans are an outgroup with respect to all non-Africans (although this assumption can be relaxed). Given a single representative sequence from each of three non-African groups, there are three possible tree topologies, each containing a single internal branch and a unique phylogenetically informative variant (PIV) pattern (Figure 2). Specifically, if exactly two out of three of the sequences share a derived allele, then the genealogy at this site has (under the parsimony assumption) the two populations with a derived allele as sister groups.
In analyzing the whole-genome sequence data described in Pagani et al., I considered a panel of 21 West and Central African samples (nine Yoruba, four Luhya, and eight pygmies), two representative European populations (Tuscans and Croats), two representative East Asian populations (Han and Japanese) and two representative Melanesian groups (Kosipe and Koinanbe). I tabulated the proportion of PIVs supporting each topology (PEA, PEM, and PAM, cf. Figure 2) across each of the eight combinations of one European, one East Asian, and one Melanesian population; these proportions were averaged over all possible choices of a single haploid sequence from each population. The results were highly consistent across the different population combinations; PAM ranged from 0.418–0.430, and PEA and PEM were always <0 .3="" a="" class="scroll-into-link" href="https://www.cell.com/ajhg/fulltext/S0002-9297(17)30146-5#tbl1" id="back-tbl1">Table 1
). So, although the “true” demographic history of non-African populations was certainly very complex, on average Melanesian and East Asian sequences are more genetically similar (and share a more recent common ancestor) than do European and East Asian or European and Melanesian sequences, and Figure 1B is likely to be the true population branching order. Note that the same conclusion was reached in the neighbor-joining tree shown in Figure 1a of Mallick et al. and in the unrooted tree in Extended Data Figure 1 of Malaspinas et al. If we assume that sub-Saharan Africans are ancestral, then this branching order was proposed by Cavalli-Sforza and colleagues more than 50 years ago.
Table 1Proportion of Sites Supporting Each Topology for Both Real and Simulated Sequence Data
PopulationsPEA (%)PEM (%)PAM (%)
Tuscan, Han, Kosipe29.128.042.9
Tuscan, Han, Koinanbe29.328.242.5
Tuscan, Japanese, Kosipe28.828.243.0
Tuscan, Japanese, Koinanbe29.028.442.6
Croat, Han, Kosipe29.428.442.2
Croat, Han, Koinanbe29.628.541.9
Croat, Japanese, Kosipe29.328.542.1
Croat, Japanese, Koinanbe29.528.741.8
Malaspinas model28.126.745.2
Pagani model 138.030.731.3
Pagani model 238.630.830.6
Pagani model 339.230.430.3
Pagani model 437.131.231.7
Pagani model 534.231.834.1
See also Figure 2.
Next, I compared the expectations for PEA, PEM, and PAM under the demographic model proposed by Malaspinas and colleagues (cf. Figure S07.3 ). My a priori expectation was that PEA would be slightly larger than PEM and PAM because their model, like Figure 1A, has Melanesians as an outgroup with respect to Europeans and East Asians. Surprisingly, I found instead that simulations under their model produce large PAM values, as expected under the branching order shown in Figure 1B (with Europeans as an outgroup with respect to East Asians and Melanesians) and as observed in the actual data (Table 1). A closer look at the parameters in their model (Tables S07.3 and S07.5) explains this apparent discrepancy. The estimated split times for Aboriginal Australians (58 Kya) and ancestral Eurasians (57 Kya) are almost identical, and more importantly, these two ancestral populations are connected by high scaled migration rates (4Nm > 10, cf. Table S07.5 in Masaspinas et al. ) after the split. One consequence of the high migration rates is that the ancestral Australians do not start diverging genetically from ancestral Europeans and ancestral East Asians until after the European–East-Asian split 42 Kya (when the migration rates decrease). I verified that this is the case by simulating sequences that were sampled from each non-African population right after the European–East-Asian split under the Malaspinas model. I found that the expected FST between ancestral Australians and ancestral Eurasians sampled at this time was <0 .001="" 42="" a="" aboriginal="" and="" asians="" australians="" behaves="" between="" branching="" class="figure-link scroll-into-link" conclude="" data-link="modal" data-locator="fig1" data-target="#image-S0002-9297(17)30146-5gr1" differentiation="" east="" finally="" genetic="" greater="" higher="" href="https://www.cell.com/ajhg/fulltext/S0002-9297(17)30146-5#fig1" i.e.="" i="" id="back-gr1" in="" just="" kyr="" leads="" like="" malaspinas="" migration="" model="" modeled="" no="" observed="" past="" populations.="" practice="" rates="" shown="" similarity="" simple="" that="" the="" these="" to="" two="">Figure 1
B. Furthermore, any model, including models with all possible branching orders for non-African populations, that has the European, East Asian, and Australian populations splitting roughly simultaneously 42 Kya (and with the same migration rates since then) should have roughly the same likelihood as the model presented in the Malaspinas paper.
I also tried to explore the claims made by Pagani and colleagues. Although they do not propose a specific demographic model, they do assume in the text that median genetic-split times estimated from MSMC analyses can be thought of as genetic divergence times between populations. I constructed five simple population models by using MSMC-estimated split times and assuming that Papuans have 0%–5% of their ancestry from an unsampled “ghost” population, which branched off from other modern human groups 120 Kya (Figure 3). Three of these models used the topology shown in Figure 1A because Pagani et al. estimated a Papuan-Eurasian MSMC split time of ∼40 Kya and a European–East-Asian MSMC split time of ∼30 Kya, whereas two models (based on Pagani et al.’s extended Data Figure 10) incorporate heterogeneity in the true population topology across the genome (see Material and Methods for details).
As expected, simulations under these models produce larger PEA values and smaller PAM values than what was found in the actual data (Table 1). These results are insensitive to assumed “ghost” admixture proportions (i.e., there is little difference between the results of models 1–3) but rather are a simple consequence of the models’ underlying population topology.
To test whether other, similar demographic models might produce results more in-line with observations, I also ran simulations under a model with the topology shown in Figure 1A, but with recent (one-way) migration from East Asians into Melanesians (Figure 3C), and under a model with the same topology as in Figure 1B. These simulations show that one-way migration increases the relative value of PAM (Table S1 in the Supplemental Data available with this article online). Qualitatively, this is because those regions of the genome affected by recent migration have a true topology with Europeans as an outgroup, and the overall values of PEA, PEM, and PAM reflect a weighted average of the different true genealogical trees across the genome. However, the magnitude of this effect does not seem to be enough to produce PAM values as large as those that are observed, even if Melanesians derive 80%–90% of their genome from East Asian migrants as recently as 10 Kya. However, such an extreme migration model would be inconsistent with the roughly constant levels of Denisovan ancestry observed across Melanesian and aboriginal Australian populations.
My simulations with Europeans as an outgroup with respect to other non-African groups showed several things. First, as expected, increasing the difference between the European and East Asian and between the East Asian and Melanesian divergence times increases the relative value of PAM because it increases the average internal branch length in Figure 1B. Second, there are parameter combinations that produce PEA, PEM, and PAM values similar to those that are observed, but these require Europeans to be a clear outgroup relative to East Asians and Melanesians (Table S1). Third, both sets of simulations show that conditioning on the absence of alleles in the Denisovan genome has almost no effect on PEA, PEM, and PAM. Finally, the presence of low (e.g., ≤5%) levels of “ghost” admixture has only a minor effect on allele-sharing statistics and is completely unnecessary for explaining the observed values of PEA, PEM, and PAM.

Discussion

In summary, we have shown that East Asian and Melanesian samples have an excess of shared derived variants, reflecting their genetic similarity to each other. (I reached the same qualitative conclusions with the Malaspinas et al. dataset, but the genomes are not fully publicly available.) These results are incompatible with simple versions of the CMM because an older divergence of Melanesian populations would lead to larger PEA values. My focus on shared variants is crucial because it concentrates on the internal branches present during the times when non-African populations diverged from each other. If instead I had just counted the number of derived variants that were present in non-Africans and homozygous ancestral in 21 sub-Saharan Africans, the Neanderthal genome, and the Denisovan genome, then Melanesians would have more of these sites (an average of 62,546) compared with East Asians (an average of 57,574) or Europeans (an average of 47,054). These “non-African alleles” are less informative about the true population branching order because they reflect a combination of other demographic factors, such as ancient admixture between Melanesians and Denisovans, as well as more recent admixture between Southern Europeans and sub-Saharan Africans.
Although I cannot formally rule out Pagani et al.’s claim of “ghost” admixture into the ancestors of Melanesians, there are several factors that make this highly unlikely. My simulations suggest that the large observed PAM values are only possible with models having Europeans as an outgroup with respect to East Asians and Melanesians (Table 1 and Table S1). However, this branching order is inconsistent with the observed MSMC split times, and these same split times were used prominently in Pagani et al.’s justification for their claim of “ghost” admixture. Simulations suggest that haplotype-based methods such as MSMC are extremely sensitive to phasing errors, and this problem is most likely exacerbated by the small number of Melanesians included in the Pagani et al. study (just three Kosipe and three Koinanbe).
Finally, the old Papuan–West-African split time estimated by Pagani and colleagues, and used as motivation for their claim of “ghost” admixture, is probably a simple consequence of Denisovan admixture into Melanesians. It is important to emphasize that the large genetic distance between the Altai Denisovan genome and the genomes of the Denisovans that interbred with the Melanesian lineage make it impossible to successfully “mask” out all Denisovan ancestry tracts in contemporary human genomes. This is evident from the fact that PEA > PEM even in simulations without “ghost” admixture and from the small effect that masking putative Denisovan SNPs has on PIV proportions (Table S1).
In addition, PEA and PEM correspond to groups 2 and 1, respectively, in the D4P test, so Rasmussen et al.’s evidence for the CMM (i.e., that group 2 is larger than group 1, or equivalently that PEA > PEM) can be directly ascribed to the effects of Denisovan admixture. Furthermore, my analyses suggest that effective methods for distinguishing between the models listed in Rasmussen et al.’s Figure 1A would include sites ancestral in Europeans but derived in East Asians and Melanesians or aboriginal Australians (i.e., PAM).
The analyses presented here have been primarily qualitative. Although PEA, PEM, and PAM could in principle be used as summary statistics in a likelihood-based parameter estimation framework, they are more useful as heuristic descriptors of the data. As such, they can serve as a “sanity-check” on the conclusions of more sophisticated (but also more opaque) analytical tools. The challenge then remains for proponents of models featuring multiple major waves of migration of modern humans out of Africa to produce an explicit, testable model of human demography that at a minimum can produce the same qualitative patterns of genetic variation as those described above.

Supplemental Data

Web Resources

References

  • White T.D.
  • Asfaw B.
  • DeGusta D.
  • Gilbert H.
  • Richards G.D.
  • Suwa G.
  • Howell F.C.
Pleistocene Homo sapiens from Middle Awash, Ethiopia.
Nature. 2003; 423: 742-747
  • Clark J.D.
  • Beyene Y.
  • WoldeGabriel G.
  • Hart W.K.
  • Renne P.R.
  • Gilbert H.
  • Defleur A.
  • Suwa G.
  • Katoh S.
  • Ludwig K.R.
  • et al.
Stratigraphic, chronological and behavioural contexts of Pleistocene Homo sapiens from Middle Awash, Ethiopia.
Nature. 2003; 423: 747-752
  • Lahr M.M.
  • Foley R.A.
Multiple dispersals and modern human origins.
Evol. Anthropol. 1994; 3: 48-60
  • Cavalli-Sforza L.L.
  • Menozzi P.
  • Piazza A.
The History and Geography of Human Genes.
Princeton University Press, Princeton, NJ; 1994
  • Vigilant L.
  • Stoneking M.
  • Harpending H.
  • Hawkes K.
  • Wilson A.C.
African populations and the evolution of human mitochondrial DNA.
Science. 1991; 253: 1503-1507
  • Ramachandran S.
  • Deshpande O.
  • Roseman C.C.
  • Rosenberg N.A.
  • Feldman M.W.
  • Cavalli-Sforza L.L.
Support from the relationship of genetic and geographic distance in human populations for a serial founder effect originating in Africa.
Proc. Natl. Acad. Sci. USA. 2005; 102: 15942-15947
  • Fu Q.
  • Hajdinjak M.
  • Moldovan O.T.
  • Constantin S.
  • Mallick S.
  • Skoglund P.
  • Patterson N.
  • Rohland N.
  • Lazaridis I.
  • Nickel B.
  • et al.
An early modern human from Romania with a recent Neanderthal ancestor.
Nature. 2015; 524: 216-219
  • Liu W.
  • Martinón-Torres M.
  • Cai Y.J.
  • Xing S.
  • Tong H.W.
  • Pei S.W.
  • Sier M.J.
  • Wu X.H.
  • Edwards R.L.
  • Cheng H.
  • et al.
The earliest unequivocally modern humans in southern China.
Nature. 2015; 526: 696-699
  • Macaulay V.
  • Hill C.
  • Achilli A.
  • Rengo C.
  • Clarke D.
  • Meehan W.
  • Blackburn J.
  • Semino O.
  • Scozzari R.
  • Cruciani F.
  • et al.
Single, rapid coastal settlement of Asia revealed by analysis of complete mitochondrial genomes.
Science. 2005; 308: 1034-1036
  • Lahr M.M.
  • Foley R.A.
Towards a theory of modern human origins: Geography, demography, and diversity in recent human evolution.
Am. J. Phys. Anthropol. 1998; : 137-176
  • Rasmussen M.
  • Guo X.
  • Wang Y.
  • Lohmueller K.E.
  • Rasmussen S.
  • Albrechtsen A.
  • Skotte L.
  • Lindgreen S.
  • Metspalu M.
  • Jombart T.
  • et al.
An Aboriginal Australian genome reveals separate human dispersals into Asia.
Science. 2011; 334: 94-98
  • Reich D.
  • Green R.E.
  • Kircher M.
  • Krause J.
  • Patterson N.
  • Durand E.Y.
  • Viola B.
  • Briggs A.W.
  • Stenzel U.
  • Johnson P.L.
  • et al.
Genetic history of an archaic hominin group from Denisova Cave in Siberia.
Nature. 2010; 468: 1053-1060
  • Reich D.
  • Patterson N.
  • Kircher M.
  • Delfin F.
  • Nandineni M.R.
  • Pugach I.
  • Ko A.M.
  • Ko Y.C.
  • Jinam T.A.
  • Phipps M.E.
  • et al.
Denisova admixture and the first modern human dispersals into Southeast Asia and Oceania.
Am. J. Hum. Genet. 2011; 89: 516-528
  • Mallick S.
  • Li H.
  • Lipson M.
  • Mathieson I.
  • Gymrek M.
  • Racimo F.
  • Zhao M.
  • Chennagiri N.
  • Nordenfelt S.
  • Tandon A.
  • et al.
The Simons Genome Diversity Project: 300 genomes from 142 diverse populations.
Nature. 2016; 538: 201-206
  • Malaspinas A.S.
  • Westaway M.C.
  • Muller C.
  • Sousa V.C.
  • Lao O.
  • Alves I.
  • Bergström A.
  • Athanasiadis G.
  • Cheng J.Y.
  • Crawford J.E.
  • et al.
A genomic history of Aboriginal Australia.
Nature. 2016; 538: 207-214
  • Pagani L.
  • Lawson D.J.
  • Jagoda E.
  • Mörseburg A.
  • Eriksson A.
  • Mitt M.
  • Clemente F.
  • Hudjashov G.
  • DeGiorgio M.
  • Saag L.
  • et al.
Genomic analyses inform on migration events during the peopling of Eurasia.
Nature. 2016; 538: 238-242
  • Tucci S.
  • Akey J.M.
Population genetics: A map of human wanderlust.
Nature. 2016; 538: 179-180
  • Excoffier L.
  • Dupanloup I.
  • Huerta-Sánchez E.
  • Sousa V.C.
  • Foll M.
Robust demographic inference from genomic and SNP data.
PLoS Genet. 2013; 9: e1003905
  • Schiffels S.
  • Durbin R.
Inferring human population size and separation history from multiple genome sequences.
Nat. Genet. 2014; 46: 919-925
  • Lawson D.J.
  • Hellenthal G.
  • Myers S.
  • Falush D.
Inference of population structure using dense haplotype data.
PLoS Genet. 2012; 8: e1002453
  • Altshuler D.M.
  • Gibbs R.A.
  • Peltonen L.
  • Altshuler D.M.
  • Gibbs R.A.
  • Peltonen L.
  • Dermitzakis E.
  • Schaffner S.F.
  • Yu F.
  • Peltonen L.
  • et al.
  • International HapMap 3 Consortium
Integrating common and rare genetic variation in diverse human populations.
Nature. 2010; 467: 52-58
  • Auton A.
  • Brooks L.D.
  • Durbin R.M.
  • Garrison E.P.
  • Kang H.M.
  • Korbel J.O.
  • Marchini J.L.
  • McCarthy S.
  • McVean G.A.
  • Abecasis G.R.
  • 1000 Genomes Project Consortium
A global reference for human genetic variation.
Nature. 2015; 526: 68-74
  • Green R.E.
  • Krause J.
  • Briggs A.W.
  • Maricic T.
  • Stenzel U.
  • Kircher M.
  • Patterson N.
  • Li H.
  • Zhai W.
  • Fritz M.H.
  • et al.
A draft sequence of the Neandertal genome.
Science. 2010; 328: 710-722
  • Satta Y.
  • Klein J.
  • Takahata N.
DNA archives and our nearest relative: the trichotomy problem revisited.
Mol. Phylogenet. Evol. 2000; 14: 259-275
  • Chen F.C.
  • Li W.H.
Genomic divergences between humans and other hominoids and the effective population size of the common ancestor of humans and chimpanzees.
Am. J. Hum. Genet. 2001; 68: 444-456
  • Meyer M.
  • Kircher M.
  • Gansauge M.T.
  • Li H.
  • Racimo F.
  • Mallick S.
  • Schraiber J.G.
  • Jay F.
  • Prüfer K.
  • de Filippo C.
  • et al.
A high-coverage genome sequence from an archaic Denisovan individual.
Science. 2012; 338: 222-226
  • Hudson R.R.
Generating samples under a Wright-Fisher neutral model of genetic variation.
Bioinformatics. 2002; 18: 337-338
  • Prüfer K.
  • Racimo F.
  • Patterson N.
  • Jay F.
  • Sankararaman S.
  • Sawyer S.
  • Heinze A.
  • Renaud G.
  • Sudmant P.H.
  • de Filippo C.
  • et al.
The complete genome sequence of a Neanderthal from the Altai Mountains.
Nature. 2014; 505: 43-49
  • Cavalli-Sforza L.L.
  • Barrai I.
  • Edwards A.W.F.
Analysis of human evolution under random genetic drift.
Cold Spring Harb. Symp. Quant. Biol. 1964; 29: 9-20
  • Hudson R.R.
  • Slatkin M.
  • Maddison W.P.
Estimation of levels of gene flow from DNA sequence data.
Genetics. 1992; 132: 583-589
  • Terhorst J.
  • Kamm J.A.
  • Song Y.S.
Robust and scalable inference of population history from hundreds of unphased whole genomes.
Nat. Genet. 2017; 49: 303-309

Figures

  • Figure thumbnail gr1
    Figure 1Schematic of Two Different Potential Branching Orders for Major Non-African Populations
  • Figure thumbnail gr2
    Figure 2Possible Genealogies for Non-African Populations
  • Figure thumbnail gr3
    Figure 3Schematics of Population Models Used for Simulations

Tables
