Recent genome studies of
modern and ancient samples have proposed that Native Americans derive
from a subset of the Eurasian gene pool carried to America by an
ancestral Beringian population, from which two well-differentiated
components originated and subsequently mixed in different proportion
during their spread in the Americas. To assess the timing, places of
origin and extent of admixture between these components, we performed an
analysis of the Y-chromosome haplogroup Q, which is the only
Pan-American haplogroup and accounts for virtually all Native American Y
chromosomes in Mesoamerica and South America.
Results
Our analyses of 1.5 Mb of 152 Y
chromosomes, 34 re-sequenced in this work, support a “coastal and
inland routes scenario” for the first entrance of modern humans in North
America. We show a major phase of male population growth in the
Americas after 15 thousand years ago (kya), followed by a period of
constant population size from 8 to 3 kya, after which a secondary sign
of growth was registered. The estimated dates of the first expansion in
Mesoamerica and the Isthmo-Colombian Area, mainly revealed by haplogroup
Q-Z780, suggest an entrance in South America prior to 15 kya. During
the global constant population size phase, local South American hints of
growth were registered by different Q-M848 sub-clades. These expansion
events, which started during the Holocene with the improvement of
climatic conditions, can be ascribed to multiple cultural changes rather
than a steady population growth and a single cohesive culture diffusion
as it occurred in Europe.
Conclusions
We established and dated a
detailed haplogroup Q phylogeny that provides new insights into the
geographic distribution of its Eurasian and American branches in modern
and ancient samples.
There
is a general agreement that anatomically modern humans entered the
American continent from Beringia between 20 and 15 thousand years ago
(kya), and two possible routes, one coastal and one inland, have been
postulated [1, 2].
The first route, accessible since 20 kya, would have probably
facilitated a rapid southward expansion along Pacific coastal regions of
the double continent, while the second one, through the so-called
ice-free corridor between the Cordilleran and Laurentide ice sheets,
might have been accessible from 15.6–14.8 kya [3]
and, according to some models, would have contributed solely or mainly
to the peopling of North America. The most favoured scenario by studies
of modern and ancient nuclear data [4, 5, 6]
is that both Athabascans and Amerindians derive from the same founding
Beringian population, which entered America prior to 13 kya, and that
the split between northern and southern Native Americans occurred south
of the North American ice sheets. This was followed by two additional
minor gene introgressions restricted to the Arctic region: the
Saqqaq/Dorset Paleo-Eskimo ~ 4.5 kya and the Thule-related Neo-Eskimo
~ 2 kya.
Until
recently, most of the genetic information concerning the first peopling
of the Americas was largely derived from the maternally transmitted
mitochondrial DNA (mtDNA), with only a few mtDNA haplogroups (Hgs) (A2,
B2, C1, C4c, D1, D4h3a and X2a) [7, 8, 9],
nested within Eurasian clades, characterizing almost all present Native
Americans. According to mtDNA studies of the last decade, these
haplogroups entered the Americas around 16 kya [10, 11], after a rather long period of standstill and differentiation in Beringia [12],
possibly following two entry routes, the first along the Pacific coast
marked by D4h3a and the second through the ice-free corridor marked by
X2a and C4c [10, 13, 14, 15, 16].
At the moment, the major difference between the conclusions of mtDNA
and autosomal DNA studies appears to concern the location of the split
between the ancestors of northern and southern Native Americans. Indeed,
a split of the first settlers in eastern Beringia (Alaska) rather than
south of the Cordilleran and Laurentide ice sheets would imply a dual
rather than a single entry into the American continent. If so, the two
entries could have occurred either at the same time or at different
times, following the same or different routes [17].
Unfortunately,
the identification of Native American founding lineages of the
male-specific region of the Y-chromosome (MSY) has been complicated by
the post-Columbian uneven male/female native population decline and by
the high historical rate of male-mediated admixture into Native American
communities. Nevertheless, two founding lineages of Asian origin, Hg C
and Hg Q, were described long ago [18].
Hg C is virtually limited to North America while Hg Q-M242 is present
as Q-L54 all over the double continent with two main Native American
founding sub-lineages: Q-M3 and Q-L54*(xM3, L330) [19, 20].
Little information is available about the distribution of these two
sub-lineages, except that they arrived concomitantly in Mesoamerica,
where Mexico acted as a recipient for the first migration wave, followed
by a rapid southward spread into the southern continent [20, 21].
In the last years, thanks to the advances in DNA sequencing
technologies, which allow large-scale analyses of nearly complete
Y-chromosome sequences, and the increasing participation of citizens to
genealogical projects (International Society of Genetic Genealogy), new
L54 sub-lineages have been identified [22, 23, 24, 25].
Yet, both the current level of resolution of haplogroup Q and its
phylogeography remain inadequate to explore the history and demography
of Native American populations from a Y-chromosome perspective.
To
provide new clues on the genetic history of the Americas, here, we
present a comprehensive re-assessment of the Pan-American Y-chromosome
haplogroup Q-L54, including a detailed reconstruction of its
phylogeography and a description of its relationships with the Eurasian
branches of haplogroup Q.
The comparison of 154 Y-chromosome sequences (Additional file 1: Table S1), of which 34 new (Additional file 2: Figure S1), with the A00 sequence [22, 26],
a member of the deepest branch of the Y-chromosome phylogeny, revealed
1550 nucleotide positions carrying a derived allelic state (1563
including recurrent positions, 1515 within haplogroup Q,
Additional file 3:
Table S2). Out of these, 826 (53.3%) variant positions were not
annotated and 488 were also not described in ISOGG, YFull or in Karmin
et al. [22]. Six variant positions were located within the coding regions of the RPS4Y1, USP9Y, UTY and ZFY genes (Additional file 4: Table S3) with a coding/non-coding variant ratio of 3.9 × 10⁻³, a value lower than the 8.1 × 10⁻³ previously reported [27]. The relationships between variants are illustrated in the phylogenetic tree of Fig. 1 and detailed in Additional file 5:
Figure S2, where the ages of the identified sub-lineages are also
provided. The tree incorporates informative SNPs outside the studied
regions, which have become available from the literature [22, 23]
and/or from genealogy websites (ISOGG tree; YFull tree). These SNPs are
included in the list of variable positions (Additional file 3: Table S2) and shown in italics in the phylogeny of Fig. 1 and in Additional file 5: Figure S2.
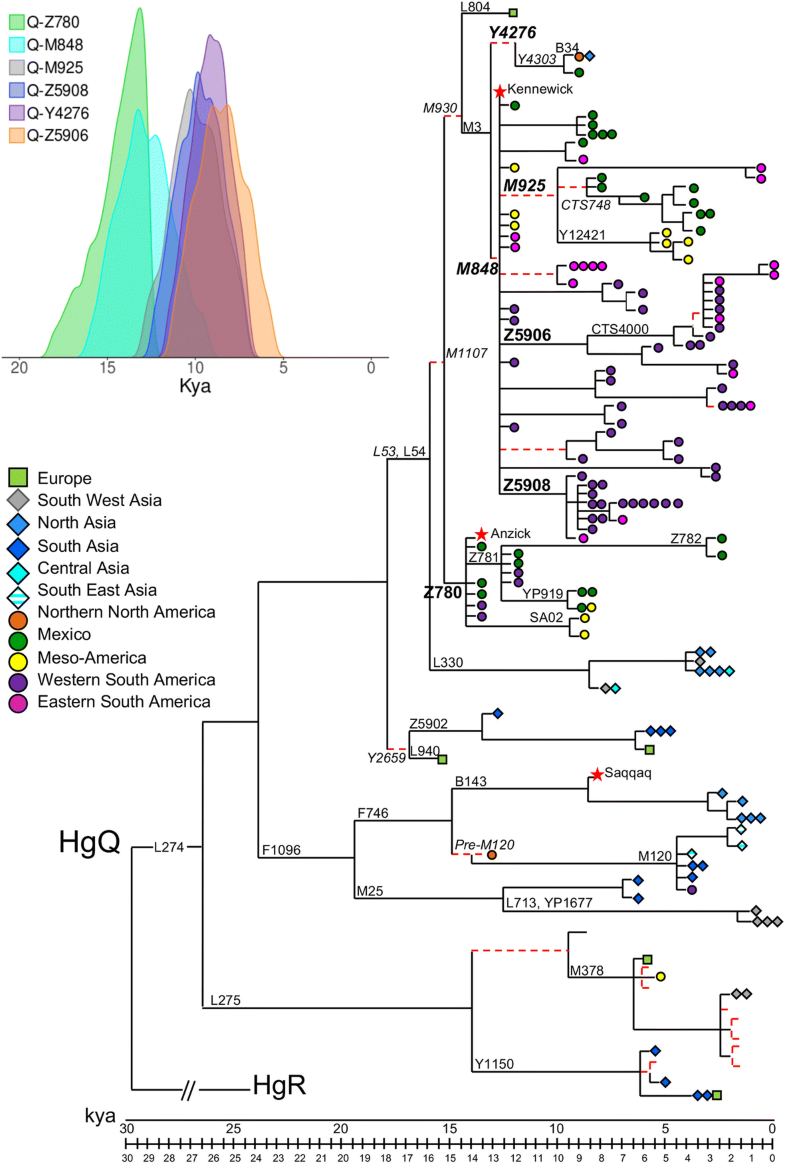
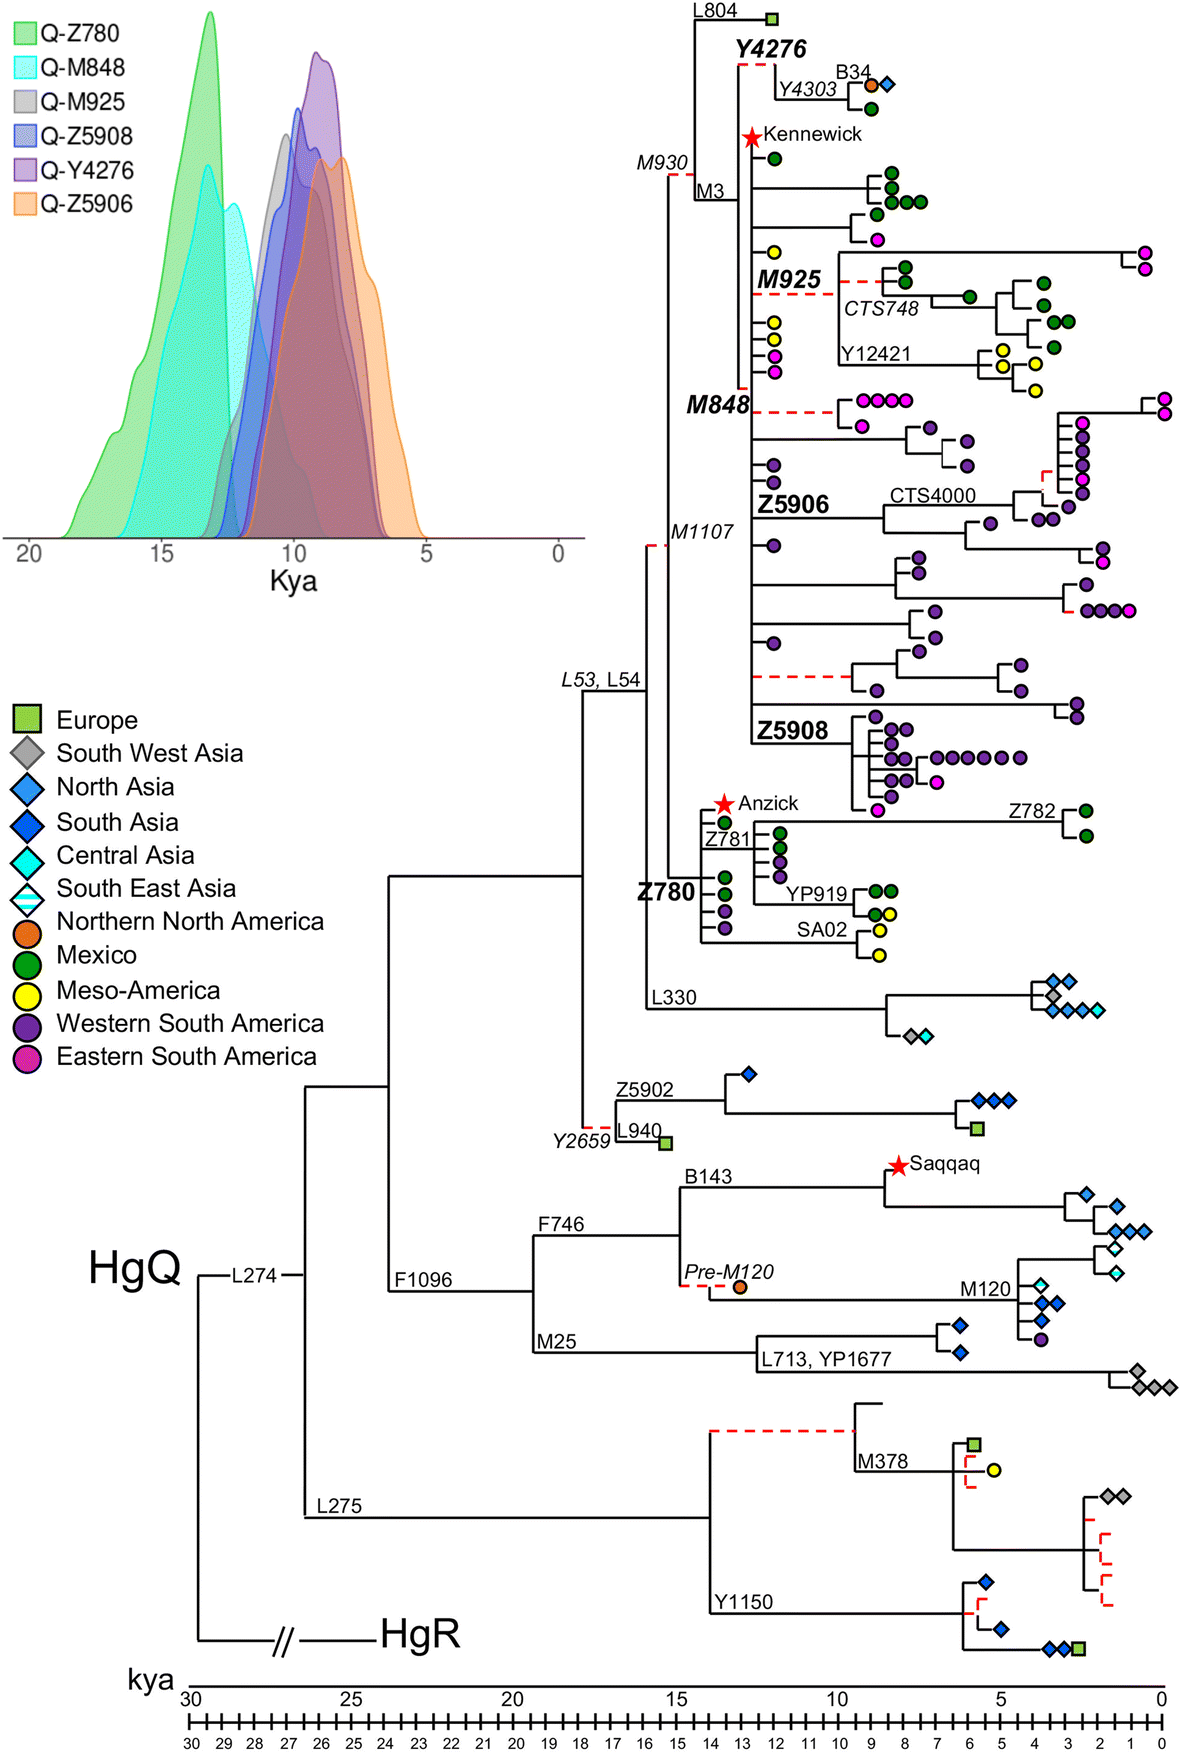
Fig. 1
Condensed version
of the most parsimonious (MP) tree of Y-chromosome haplogroup Q. This
tree was obtained considering 1550 variable positions in 149 modern
(this work; [22, 23, 26, 30, 39, 57, 58, 59, 61, 62]) and 3 ancient [6, 28, 58] Y chromosomes. Their geographic origin and Y-chromosome haplogroup affiliation are reported in Additional file 1:
Table S1. The length of each branch is proportional to its age
estimate. The name of the marker(s) defining the branches discussed in
the text is shown. Markers reported in italics are outside the sequenced
fragments, and the relative branches are reported as dashed red lines.
Stars indicate ancient Y chromosomes, squares Europeans, rhombi Asians
and circles Native Americas; colours of the symbols are according to the
macro-areas defined in Additional file 2:
Table S2. The 95% highest posterior density intervals for the Q-Z780,
Q-M848, Q-M925, Q-Z5908, Q-Y4276 and Q-Z5906 TMRCAs are shown in the
inset
The
phylogeny reveals four main bifurcations identifying five main
sub-haplogroups of Q: Q-L275, Q-F1096, Q-Y2659, Q-L330 and Q-M1107. Two
sub-branches of Q-M1107, Q-Z780 and Q-M3, are American-specific and
characterize the ancient remains of Anzick-1 and Kennewick,
respectively; Q-F1096 harbours Asian and Arctic Native American samples
as well as the Greenland ancient specimen belonging to the Saqqaq
culture [28], while the remaining sub-haplogroups include only Eurasian Y chromosomes.
To
investigate the distribution of the main clusters as well as the
identified Native American sub-haplogroups, we performed a hierarchical
genotyping of the main haplogroup-defining markers (Additional file 6:
Table S4) in 409 modern samples of our dataset (320 Native Americans
and 89 from Eurasia). The haplogroup classification, summarized in
Additional file 7: Table S5, was combined with data available in the literature (Additional file 8: Table S6), and the geographic distribution of the most diffused haplogroups is illustrated in Additional file 9: Figure S3, Additional file 10: Figure S4, Additional file 11: Figure S5, Additional file 12: Figure S6, Additional file 13: Figure S7 and Additional file 14: Figure S8.
The modern Eurasian branches of haplogroup Q and their link with proto-Native Americans
Q-L275 is the branch originated by the first bifurcation (before 26 kya; between 27.8 and 32.5 kya according to Poznik et al. [29])
of haplogroup Q. It comprises Q-Y1150 and Q-M378. The first is mainly
observed in Southwest Asia with some appearances in Northwest Eurasia,
while the second, recently dissected [30],
is spread across West, Central and parts of South Asia and harbours
mainly Middle Eastern Y chromosomes, with one branch typical of
Ashkenazi Jews, as well as European samples (Additional file 9: Figure S3a,b). Based on this distribution, the two M378 Y chromosomes observed in the Isthmo-Colombian area (Additional file 9: Figure S3b) should be interpreted as the result of a post-Columbian arrival from Eurasia, as previously hypothesized [20].
Q-F1096
splits into Q-F746, which in turn includes Q-B143 and Q-M120, and into
Q-M25. The distribution of Q-B143 both in Northeast Siberia, in the
North American Arctic and in Greenland (the F746 Y chromosomes observed
in the Athabaskans [19] and in different Greenland districts [31]
are likely Q-B143) is in agreement with a Paleo-Eskimo dispersal of
this lineage. Indeed, the Saqqaq Y chromosome, which belongs to this
haplogroup, was dated ~ 4 ky [28], in the period of the first colonization of the North American Arctic accomplished by Paleo-Eskimos.
Q-M120,
widespread in Southeast Asia, is observed in one South American subject
while a pre-M120 chromosome was described in Alaska. According to the
phylogeography (Additional file 9: Figure S3c) and STR haplotype variation of Q-M120 [32],
the South American subject might be ascribed to a recent event of gene
flow. This is not the case for the Alaskan Y chromosome, which stems
from a precursor of M120 (hence named Q-pre-M120) dated 14.2 ± 2.1 ky.
Q-M25
is observed from Eastern Europe until Central Asia with its highest
frequency in the Iranian Plateau where it is virtually only represented
by its clade Q-L712 (Additional file 9:
Figure S3c). This lineage has not been observed in present-day North
Native Americans, but it has been recently reported in ancient Aleutian
Islanders, ancient northern Athabaskans and in a 4250-year-old
individual of the Chukotkan Ust’-Belaya culture [33].
Q-Y2659 (Additional file 10:
Figure S4a) was not observed in America. It includes two branches, the
first, Q-Z5902, mainly observed in South Asia while the second, Q-L940,
in Western Eurasia. The latter includes a Northwestern European
sub-lineage, Q-FGC7000, observed also in a Sardinian subject. Although
this could be interpreted as the result of a recent gene flow event, it
could also represent a relic of the ancient migrations that brought the
first settlers on the island as for Y-chromosome haplogroup G-L91 [34] and some mtDNA haplogroups [35, 36].
Q-L53: the phylogenetic crossroad of Asian-, European- and American-specific branches
Q-L53(xL54) Y chromosomes have been described in Central Asia [20, 37].
Recently, Q-L53(xL54) Y chromosomes have been reported in five Eastern
European subjects as belonging to the new clade Q-YP4004
(Additional file 10: Figure S4b, YTree v6.02 - https://www.yfull.com/tree/Q/). These findings suggest that also the Central Asian Q-L53(xL54) Y chromosomes described above [37] belong to the Q-YP4004 branch. Interestingly, one ancient specimen from the Lovelock Cave in Nevada dated 1.8 ky [38]
falls in this clade representing the only evidence of this lineage in
America. Therefore, L53 likely originated in Central Asia and, before
spreading, differentiated into Q-YP4004 and Q-L54.
Q-L54 includes Q-M1107, which encompasses the European Q-L804 and the Native American clades Q-Z780 and Q-M3 (Fig. 1; Additional file 10: Figure S4b,c) and the Eurasian branch Q-L330 [19].
The Q-L330 branch is mainly diffused in Central East Asia with few representatives in Western Eurasia (Additional file 10:
Figure S4b). The age of its MRCA has been estimated at 8.3 ± 1.5 ky,
much younger than the bifurcation that separates this lineage from
Q-M1107 (15.6 ± 1.8 kya). However, the estimate is based essentially on
East Asian subjects belonging to only one of the two L330 branches;
therefore, the value might be biased and the actual Q-L330 MRCA could
predate the estimated age. The lower frequencies of Q-L330 compared to
its sister clade Q-M1107 suggest that Q-L330 underwent a strong
bottleneck somewhere in Central Asia before spreading in Eurasia.
Q-L804 is represented in our phylogeny by one English Y chromosome previously identified as sharing a deep node with Q-M3 [39]. This finding is in full agreement with the Q Nordic project of FTDNA (http://hoijen.se/2016/01/29/q-l804-current-status-2016-01-29/)
that has detected this rare and apparently European-specific lineage in
English, Norwegian and French participants (Additional file 10:
Figure S4c). These results support an Asian origin of M930, the
upstream marker of L804 and M3, a North Eurasian route of dispersal and a
recent dissemination in some North European populations.
The Native American-specific branches Q-Z780 and Q-M3 and their sub-clades
Q-M3
and Q-Z780 are the two main Y-chromosome founding lineages of Native
Americans. Both have been observed in ancient American DNAs: the
Anzick-1 Y chromosome, which is dated at 12.6 ky [40] and belongs to Q-FGC47532, a sub-branch of Q-Z780, and the Kennewick Y chromosome, dated at 9.0 ky [41], which falls into Q-M848 (Fig. 1). Although Q-Z780 coalesces at 14.3 ± 1.6 ky and Q-M848 at 12.5 ± 1.6 ky, their simultaneous arrival in Central America [20]
suggests their presence in the first Native American founding
population groups. On the other hand, the lower age of Q-M848 (see also
its 95% highest posterior density interval—Fig. 1, inset) could be biased by the age of the great expansion that this branch underwent.
Inside Q-M3, the two branches Q-Y4276 and Q-M848 are distinguishable.
Despite its poor representation in the tree (Fig. 1), Q-Y4276 displays the widest geographic distribution, being observed from Siberia to South America (Additional file 11:
Figure S5). It is the main clade found in the USA (in Virginia,
Carolina and Georgia but also in the South West) where it is present as
Q-Y4276*, Q-Y4300 and Q-Y4303* and seems to be associated with subjects
speaking Algonquian language (http://haplogroup.org/native-american-q-m3-tree-p2-q-m242-news-6-nov-2016/).
Algonquian is one of the most populous and widespread North American
Native language groups. Historically, it was prominent along the
Atlantic Coast and into the interior along the St. Lawrence River and
around the Great Lakes and the Rocky Mountains. In North America, the
distribution of the Y-chromosome lineage Q-Y4276 parallels that of mtDNA
haplogroups X2a and the rare C4c (Additional file 15: Figure S9) [11],
which have been postulated to have entered from Beringia into North
America through the ice-free corridor between the Laurentide and
Cordilleran ice sheets [9, 10, 14].
Thus, it is possible that the same groups carrying the mtDNA
haplogroups X2a and C4c might have brought Q-Y4276 Y chromosomes in
North America. Moreover, the “Northern Native American” or “Ancestral B”
(ANC-B) component identified in several ancient Native American genomic
studies [4, 5, 38, 42] displays a similar pattern.
Interestingly,
the observation of Q-Y4303* in a single Brazilian sample is reminiscent
of an analogous finding, i.e. the rare mtDNA haplogroup C4c in Colombia
[14], and supports the scenario that genomic ANC-B might have contributed to the Central and South American gene pool [5],
either through an ancient migration of this lineage or through a recent
contact with the Northern sub-continent. The well-differentiated
position of the Brazilian sample in the network of the STR haplotypes
associated with this haplogroup (Additional file 11:
Figure S5) seems to support the first scenario. If this interpretation
is correct, the finding of this lineage in Brazil, but not in the
numerous samples from the western regions, would suggest that it entered
South America through the Atlantic coastal route [15] instead of the Pacific coastal route [16].
The MRCA of this clade has been dated 9.3 ± 1.2 ky, thus extensively
post-dating the peopling of the Americas; however, its STR variation
evaluated on a wider dataset would place its age estimate in the time
frame of the first entry into the double continent.
Q-M848 is the most represented branch of haplogroup Q in the Americas both in modern and ancient times (Additional file 12: Figure S6, Additional file 13: Figure S7 and Additional file 16: Figure S10). Q-M925
is the most diffused of its sub-haplogroups, with samples from the USA
to South America. It includes four branches (Q-Z4012, Q-Y26547, Q-Y12421
and Q-CTS748) with specific geographic distributions and some still not
sub-classified Y chromosomes (M925*). Q-Y26547 is found in two Brazilian samples; Q-Y12421 is observed both in Mexico and the Southwest USA and characterizes the majority of Panamanian M3 Y chromosomes; Q-CTS748
encompasses almost all the Mexican M3 Y chromosomes of our dataset,
with half of these further characterized by the CTS1002 marker. In
addition, it is also sporadically observed in the Southwest USA (https://haplogroup.org/native-american-q-m3-tree-p2-q-m242-news-6-nov-2016//). The age estimate of Q-M925 is 9.8 ± 1.4 ky (Additional file 12: Figure S6; inset of Fig. 1).
Among the three branches tested in this study, the Mexican Q-CTS748
turned out to be the most ancient (8.5 ± 1.4 ky), followed by its
sub-clade Q-CTS1002 (6.8 ± 1.2 ky). The remaining two branches are much
more recent (Q-Y12421: 5.3 ± 1.0 ky; Q-Y26547: 1.2 ± 0.6 ky) although
their age estimates could be biased by the very small number of samples
included in the tree. Network analyses of the STR haplotypes
(Additional file 12:
Figure S6), associated not only with Q-CTS748 but also with Q-Y12421,
reveal an internal high complexity of these clades, suggesting the
presence of unidentified sub-clades as well as older ages.
Q-Z5906 and Q-Z5908 display similar distribution patterns (Additional file 13:
Figure S7) from Mexico to Argentina with a frequency peak in Peru where
both show the greatest diversification, each one including a local
specific sub-clade: Q-M557 and Q-SA01, respectively. Q-Z5906 is almost
completely represented by CTS4000, present at high frequency also in
Bolivia (Additional file 13:
Figure S7a). As shown in the network of the STR haplotypes, a clear
expansion of all Z5906 sub-lineages is detected in Peru and Bolivia.
Conversely, Q-Z5908 (Additional file 13:
Figure S7b) displays an earlier differentiation without any sign of
expansion of its sub-lineages despite being well represented in that
area. The differences observed for these two clades could be due to
dissimilar subsistence behaviours and demographic dynamics over time of
their carriers.
As for Q-Z780 (Additional file 14:
Figure S8), the present level of resolution distinguishes three main
groups of Y chromosomes: Q-Z781, Q-SA02 and Q-Z780*(xZ781, SA02). The
first is the most represented and structured as well the oldest
(12.5 ± 1.5 ky). Its dating indicates that it is nearly coeval with
lineage Q-FGC47532 characterizing the Anzick-1 Y chromosome (14C
dated at 12.6 kya). However, the microsatellite variation associated
with Q-Z781 suggests an older age. Q-Z781 includes three sub-lineages,
Q-YP910, Q-Z782 and Q-YP919. While Q-YP910, represented in the tree by
only one subject, cannot be dated, Q-Z782 and Q-YP919 turned out to be
3.1 ± 1.1 ky and 9.6 ± 1.4 ky old, respectively. Q-YP919 includes two
Mesoamerican expansions, marked by the BZ1716 and M4743 mutations, well
defined in terms of STR variation and dated to about 5 kya
(Additional file 14:
Figure S8). Another Mesoamerican contemporaneous expansion event is
also registered by Q-YP910. Q-SA02, which is represented by few samples
and dates back to 9.3 ± 1.5 kya, seems to be restricted to the
Isthmo-Colombian Area. Chromosomes Z780*(xZ781,
SA02) are observed both in Mexico and in the Andean region and are
characterized by a wide variation and a complexity still to be resolved
as shown in the network of their STR haplotypes (Additional file 14: Figure S8), where at least two highly variable sub-lineages are visible, suggesting an ancient origin of their MRCA.
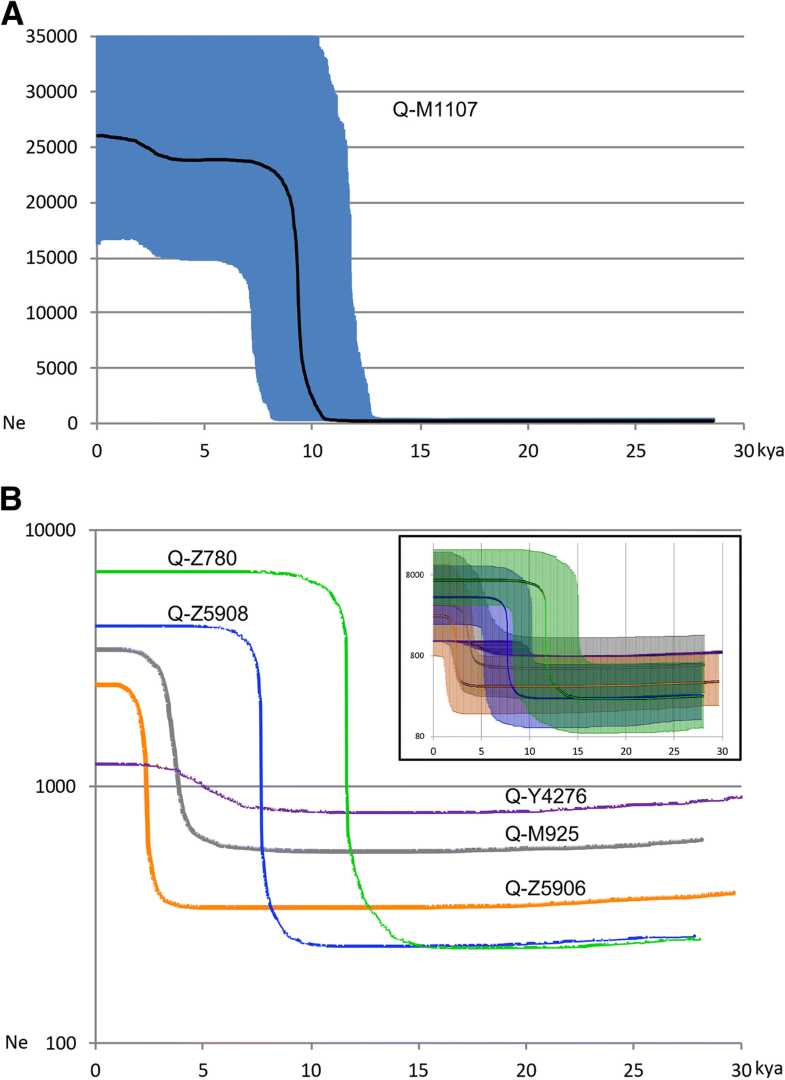
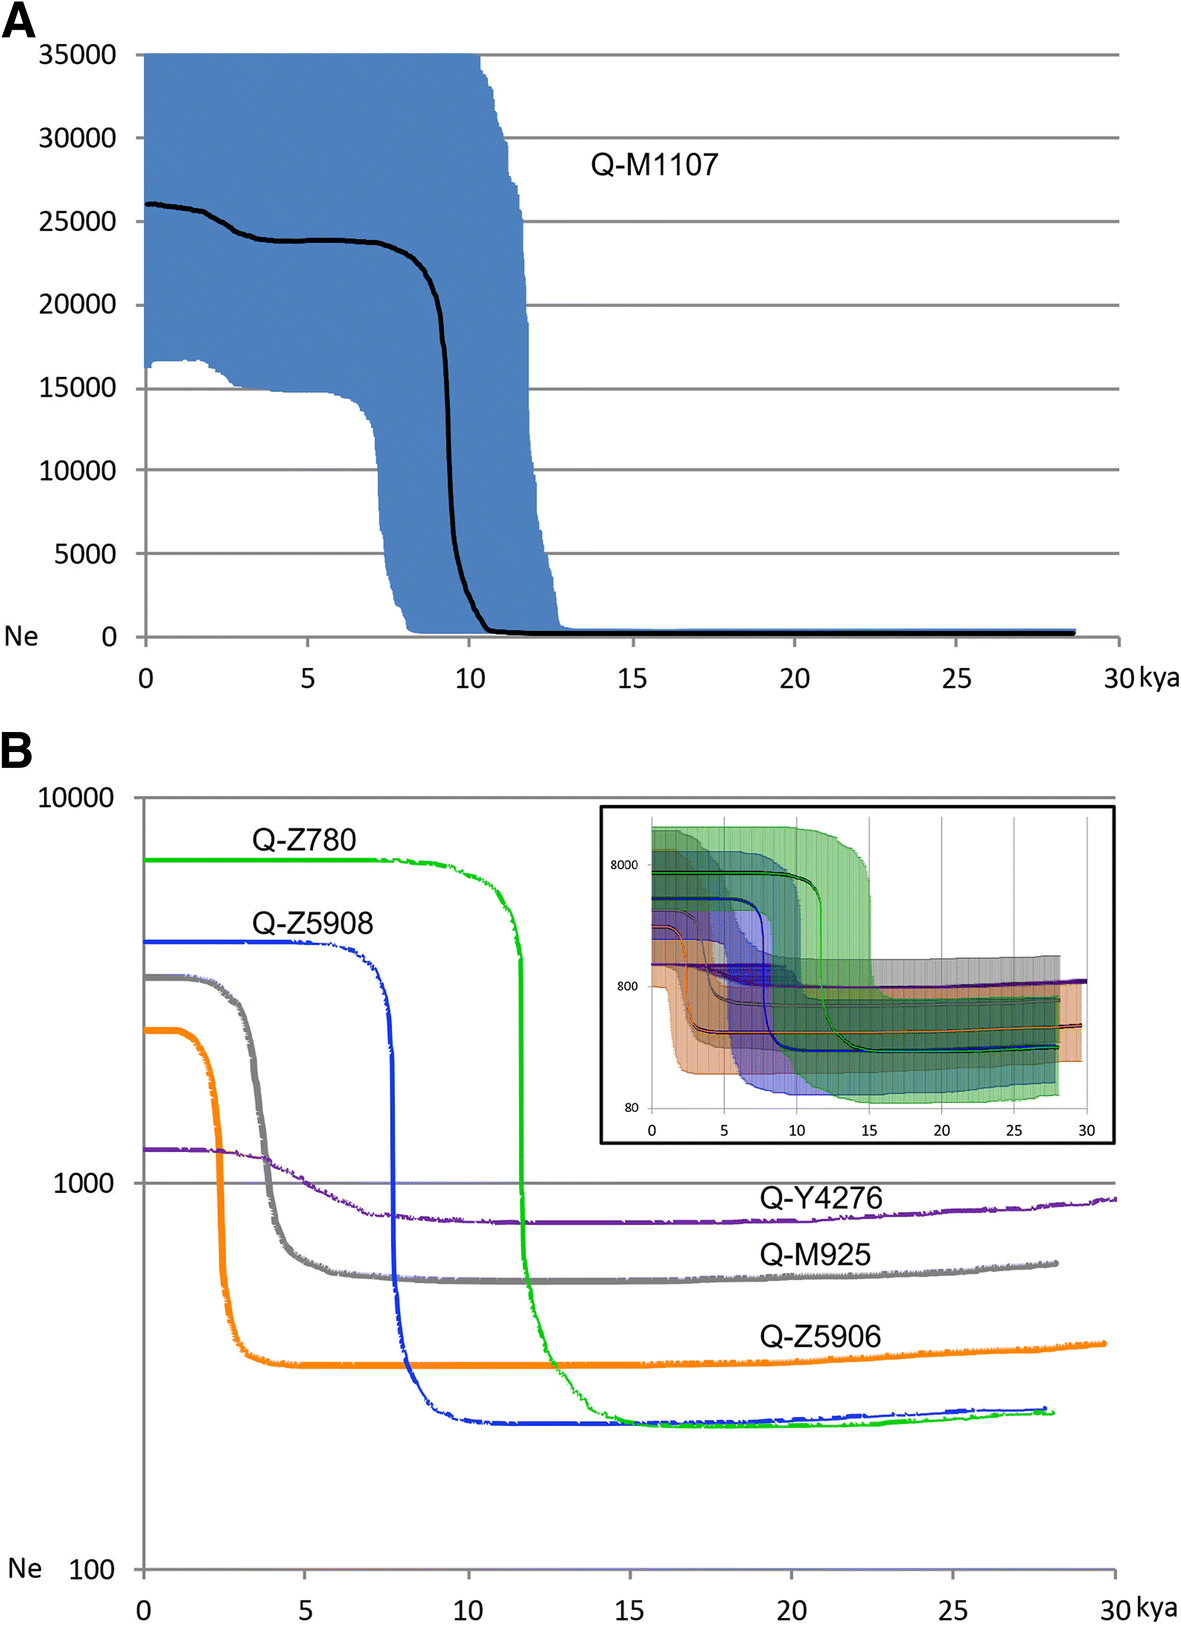
Bayesian analyses: different regional population growths after the initial expansion of Q-M1107 into the Americas
Through
a Bayesian method, the posterior distribution of the effective
population size through time was estimated for the entire sample of
Native Americans and, separately, for the samples belonging to the most
significant sub-haplogroups described above (Fig. 2). The analysis of the entire Q-M1107 (Fig. 2a)
shows a major phase of population growth after 15 kya followed by a
period of constant population size from 8 until 3 kya when another
slight sign of general population growth is apparent. Taking into
account that only few samples were from North American Natives, the
first part of the curve could be mainly ascribable to two important
growth events. The first revealed by haplogroup Q-Z780 (green curve in
Fig. 2b)
started around 15 kya in Mesoamerica and in the Isthmo-Colombian Area,
in agreement with an entrance in South America prior to 15 kya [43].
The second one, registered by haplogroup Q-Z5908, occurred during the
Holocene in the western part of South America (Peru) and was probably
associated with the improvement of the climatic condition [44]. This is the period when the domestication of cassava, pumpkin and sweet potato slowly started in the region [45].
Afterwards, American population size remained constant until 3 kya when
the second period of growth started. This scenario is also supported by
the hints of growth of Q-M925 (grey in Fig. 2b) mainly in Mesoamerica (Additional file 12: Figure S6) and of Q-Z5906 (orange curve in Fig. 2b) mainly in Peru (Additional file 13:
Figure S7). A similar trend emerges also from archaeological data in
South America: a first signal of growth linked to a resource-limited
(megafauna extinction) growth over time was followed in North West South
America by about 9 ky of slow domestication until 3 kya when cultural
and technological changes occurred [46] causing a shift to a predominantly sedentary and agricultural subsistence with the consumption of maize and sweet potato [45, 47].
What appears from these reports is that changes in South America were
isolated and different for each population, due to divergent
environments and geographic barriers, hence not able to support a single
cohesive culture diffusion as in Europe [48].
Fig. 2
Bayesian skyline
plots (BSPs) of Q-M1107 lineage and its main sub-lineages in Native
America. Bayesian skyline plot (BSP) depicting the population size
changes through time in the Americas for the 1.5 Mb of the Q-M1107 Y
chromosomes included in the phylogenetic tree of Fig. 1. All Native American M1107 Y chromosomes were considered together in panel a, while only those belonging to the main sub-lineages were assessed separately in panel b. Timing of events was estimated on the basis of Kennewick’s and Anzick-1’s radiocarbon dates [40, 41]. The x-axis is in calendar thousand years before present, and the y-axis equals changes in effective population size (shown as the product of Ne and generation time T). The black and coloured lines in panel a and in panel b, respectively, are the median estimates while the shadings in panel a and in the inset of panel b show 95% highest posterior density intervals. The time axis is limited to 30 kya, beyond which the curve remains flat
The peopling of America: considerations from the dissection of Y-chromosome haplogroup Q
The
Asian origin of Native Americans is well established, and several
migration models and entry scenarios have been proposed (mostly by
analysing uniparental markers) to account for the variation observed in
modern Native Americans [9, 10, 12]. In the last years, genome studies on modern and ancient samples have confirmed the Asian origin of Native Americans [2]
indicating that (i) present-day Natives descend from at least three
distinct ancient waves of migrations, the first along the double
continent and the other two in northern North America involving Paleo-
and Neo-Eskimo populations around 5 kya and 1 kya, respectively; (ii)
the main contribution derived from groups of people that separated from
the ancestors of present-day East Asians more than 20 kya and that
settled in Beringia for several thousand years, before moving into North
and South America; and (iii) two main components, one in North Native
Americans and one shared by Central and South American peoples, were
distinguishable [28, 40, 41, 49, 50].
The northern branch would be ancestral to populations including the
Algonquian, Na-Dene, Salishan and Tsimshian speakers of Canada and
likely the ancient Kennewick while the Southern branch would include the
ancestors of all Native Americans from Mexico and Central and South
America as well as Anzick-1. The recent sequencing of one 11.5-ky-old
genome from Siberia (USR1) allowed to identify a distinct ancient
Beringian population closely related to Native Americans but basal to
all previously sequenced contemporary and ancient Native Americans [4].
Subsequently, the information derived from the genome sequencing of a
large number of ancient samples from two areas of North America occupied
by modern humans since 13 kya, the Channel Islands of California and
Southwestern Ontario, confirmed the presence of two basal ancestries
(ANC-A and ANC-B) [5, 38].
These two components turned out to be equally distant from the Siberian
USR1 sample but, in contrast to previous proposals, to be unevenly
represented in Central and South America. To explain these observations,
the authors proposed a split of the ancient Siberian population
followed by some thousand years of differentiation of the two branches
in North America and subsequent multiple events of admixture [5]. However, the time and the place of this split (within North America [5], Northeast Asia or Eastern Beringia [4]) and the routes followed by the carriers of the two components are still under evaluation/discussion [4, 5, 17, 38, 42].
Our
study, focused on Q, the only Pan-American Y-chromosome haplogroup,
confirms the Asian origin of Native Americans and provides information
about the main Asian-American migrations as well as some unsuccessful
migration attempts (in terms of Y-chromosomes) and some back migrations
(Fig. 3). Q-M1107,
which encompasses the majority of Native American Y chromosomes,
provides information about the first peopling of the Americas. One of
its branches, Q-Z780 (previously known as Q-L54*(xM3, M330)) is observed only in America whereas the other, Q-M930, encompasses both the Pan-American Q-M3, which is also found only in the Americas and the Northwest European Q-L804.
Thus, it is likely that Q-Z780 and Q-M930 were both present in the
ancestral Asian/Beringian source population that gave rise to Native
Americans.
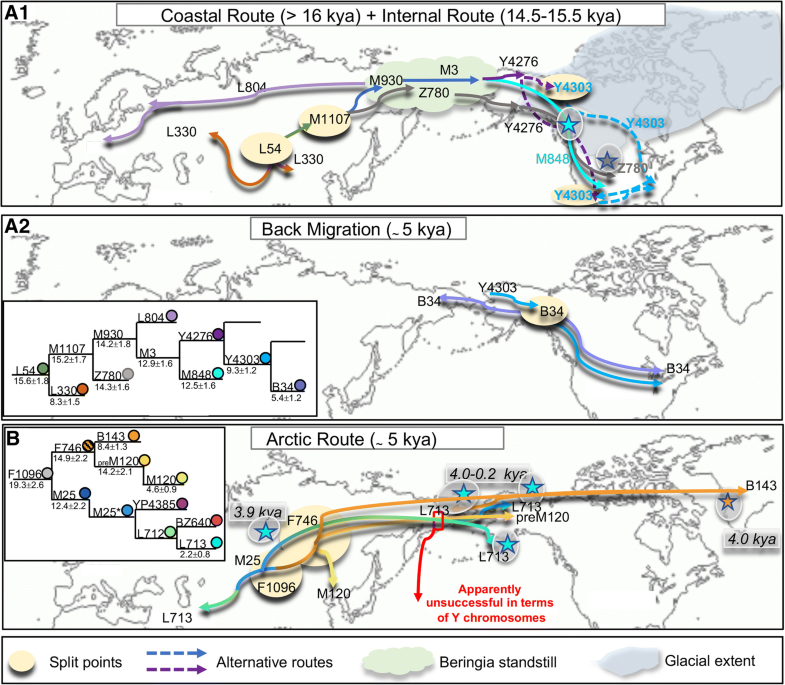
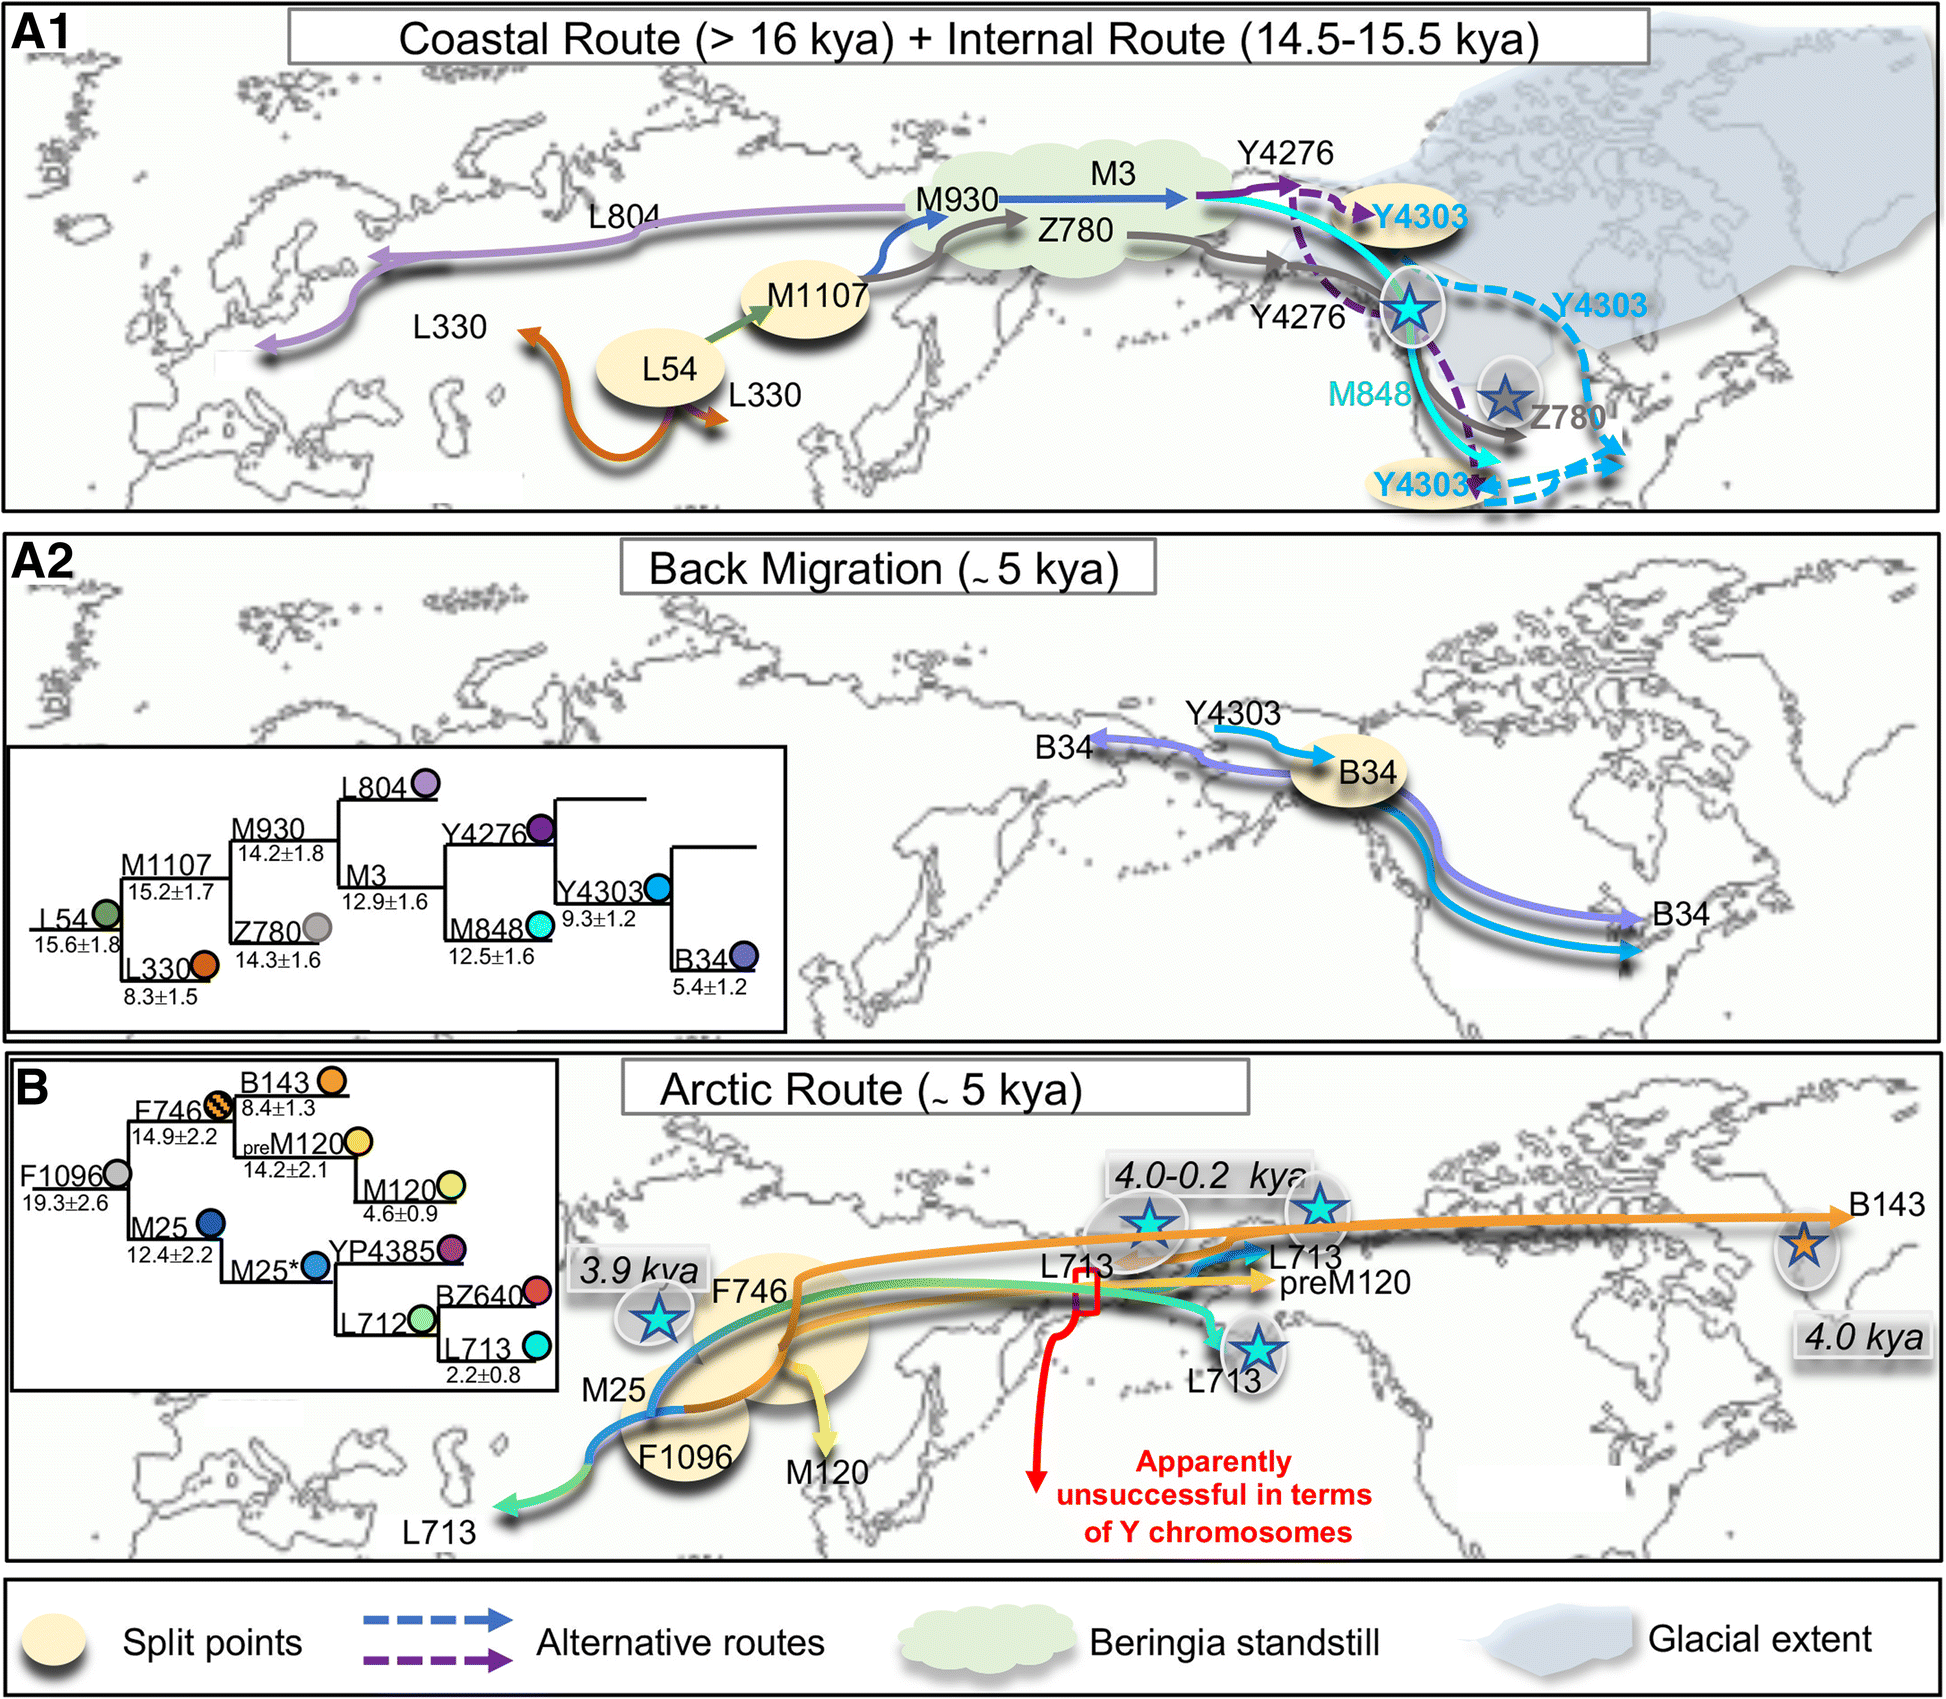
Fig. 3
Main migratory
events from Beringia/Asia towards North America and back migrations
according to the Y-chromosome variation. Schematic representation of the
spread of the Q-L54 sub-lineages Q-L804 and Q-L330 in Eurasia and of
Q-Z780, Q-M848 and Q-Y4276 from Beringia to North America (A.1) and back migration to Asia of Q-B34 (A.2). For Q-Y4276, we propose two possible entry routes (dashed lines) into North America. B
Schematic representation of the spread of the Q-F1096 sub-lineages
Q-L713 and Q-M120 in Eurasia and of Q-L713, Q-preM120 and Q-B143 in
Arctic North America. While Q-pre-M120 and Q-L713 mark migrations
towards North America apparently unsuccessful in terms of Y chromosomes,
Q-B143 reached Greenland. The presence of recent Q-B143 Y-chromosomes
in the Koryaks of Siberia can be explained by a back migration. The two
insets illustrate the phylogenetic relationships of the Q sub-lineages
(in different colours). Stars highlighted by a grey shading refer to
ancient samples
Q-Z780,
whose age estimate seems to overlap (14.3 ± 1.6 ky) the melting of ice
sheets (14.5–15.5 kya), most likely was carried by the first settlers of
the double continent and moved rapidly southward following the Pacific
coastal route. It characterizes Anzick-1 Y chromosome (12.6 ky) in North
America and four ancient specimens (8.3–3.3 ky) in South America [42].
Q-M930 differentiated into Q-L804 and Q-M3 during the Beringian standstill [51].
From Beringia, carriers of the first branch moved westwards reaching
North Europe while Q-M3 entered the American continent where it further
differentiated into Q-M848 and Q-Y4276. Q-M848, whose variation is only slightly lower (12.5 ± 1.6 ky) than that of Q-Z780 (Fig. 1),
likely moved also southward along the Pacific coast probably together
with the “Southern Native American” or “Ancestral A” (ANC-A) component [5, 38, 42].
In
Central America, both Q-Z780 and Q-M848 show clades older than 10 ky,
confirming the rapid and nearly simultaneous arrival in the region. In
South America, only Q-M848 is well represented, displaying different
potentially “area-specific” clades with coalescent times around 8.0 ky.
Q-M848 characterizes almost the totality of the ancient samples
(Additional file 16: Figure S10) from North America [4, 28], the Californian Islands [5] and from Patagonia [52].
As
for M3, the second Native American-specific branch, it is likely that
its Q-Y4276 sub-branch arose in Beringia, evolving early into Q-Y4303 in
northern North America as suggested by its estimated age (9.3 ± 1.2 ky)
(Fig. 3A.1).
From there, the population(s) carrying these markers migrated southward
spreading Q-Y4303 in the southern part of California and in Mexico and
the sub-branch Q-Y4300 to the eastern part of northern North America
where it characterizes Algonquian groups (Additional file 11:
Figure S5). The few Q-Y4300 subjects observed in Southwest USA/Mexico
might represent the legacy of Southern Athabaskans. An early
differentiation in northern North America of Q-Y4303 would also explain
the distribution of its sub-branch Q-B34 in the northern area of North
America as well as its presence in two ancient samples from Alaska and
Quebec [5].
On the other hand, the presence of Q-B34 (5.4 ± 1.2 ky) also in the
Koryak of Siberia can be easily attributed to a back migration (Fig. 3A.2), as postulated for mtDNA haplogroup A2a [11].
Q-F1096, which is diffused in Asia where it comprises Q-M25 (dated 12.4 ± 2.2 ky) and Q-F746
(dated 14.9 ± 2.2 kya), provides information about ancient movements
towards Beringia and the Eskimo diffusions into the Arctic regions of
North America (Fig. 3B). Indeed Q-M25, which is frequent in modern Western Eurasians [53, 54], is described as Q-L712 and Q-L713 in ancient samples from the Beringian area [33]
indicating that, during the warmer mid-Holocene period, populations
carrying different haplogroup Q lineages reached the former Beringian
area but gave a limited contribution to the modern Y chromosome gene
pool. Differently, Q-F746,
which is common in Southeast Asia as Q-M120 (4.6 ± 0.9 ky), encompasses
the pre-M120 lineage (dated 14.7 ± 2.3 ky) observed in an Alaskan
subject (Tsimshian), the Q-B143 lineage (8.4 ± 1.3 ky), which
characterizes the Saqqaq Paleo-Eskimo (4 ky), and the new branch Q-PV706
(2.8 ± 0.9 ky) observed in a few Koryaks of Northeastern Siberia. Thus,
the Alaskan pre-M120 might represent a relic of the East Asian
contribution to the ancient Siberian population involved in the first
peopling of the Americas that, differently from Q-Z780 and Q-M848
lineages, did not have success.
Q-B143
would trace the Paleo-Eskimo migration at around 4 kya; in this
scenario, the Q-F746 Y chromosomes observed in the North America Arctic [19]
and not yet assessed for B143 could include both Paleo- and Neo-Eskimo
contributions to the Arctic people; in turn, the lineage Q-PV706
observed in the Koryaks might represent either an East Asian evolution
of Q-F746 or a back migration from North America as for Q-B34.
During
the long standstill in Beringia of the ancestors of Native Americans,
the Beringian gene pool was characterized not only by the two M1107
branches, Q-M930 and Q-Z780, but probably also by Q-F746 as a precursor
of Q-pre-M120 and Q-B143. Prior to their entry into the Americas with
the first settlers, both Q-Z780 and Q-M3 underwent further
differentiation and genetic drift. Q-F746 instead does not appear to
have participated to the first peopling of America: the pre-M120, which
still persists in the Tsimshian population of Alaska, was apparently
unsuccessful; Q-B143 must have survived in Siberia in ancestral Eskimo
populations until its diffusion in the North American Arctic after
5 kya. Thus, with regard to the first peopling, the split of Q-M3 into
Q-M848 and Q-Y4276 could correspond to the separation of the two main
population groups. In this scenario, Q-M848 and Q-Z780 would have been
carried along the Pacific coast by the population group that gave rise
to the ANC-A component, whereas Q-Y4276 could have followed the internal
route as Q-B34 and Q-Y4300 contributing, together with the mtDNA
haplogroups X2a and C4c (Additional file 15:
Figure S9), to the component (ANC-B) that mostly appears to
characterize northern Native Americans. In such a scenario, taking also
into account the back migration of Q-B34, the split of the populations
ancestral to ANC-A and ANC-B would be best placed in eastern Beringia
prior to their entry into America. On the other hand, new data [3]
indicate that ice-free corridor was viable much earlier than previously
thought (15.6–14.8 kya), thus reviving the possibility of distinctive
migration paths of the ancestral Native American components. The
observation that the Kennewick genome, which carries mtDNA haplogroup
X2a and belongs to the ANC-B component, is characterized by the
Y-chromosome haplogroup Q-M848 suggests also that the following
(recently proposed) admixture events [5] must have started very early in North America.
In
conclusion, we established and dated a detailed haplogroup Q phylogeny
that provides new insights into the geographic distribution of its
Eurasian and American branches in modern and ancient samples.
For
the first time, we found two distinct Y chromosome lineages mirroring
the two main “ancestral” components (ANC-A, ANC-B) previously
characterized by recent genomic studies [5, 38, 42].
The differentiation of these lineages likely occurred in eastern
Beringia before their entry into America following two routes: the
coastal route (ANC-A, Q-Z780/Q-M848) and the internal route (ANC-B,
Q-Y4276). Once entered America, these two ancestral components probably
admixed very early in North America as suggested by the ancient
Kennewick nuclear genome belonging to ANC-A (Q-M848) yet carrying an
ANC-B mtDNA haplogroup (X2a).
Moreover,
we traced two major expansions of the ANC-A lineages in Meso- and South
America, one around 15 kya, early after the first peopling, and another
at 3 kya, following climatic improvements and local cultural
transitions.
Further
support to our conclusions and new insights might come from the
analysis of Native modern and ancient genomes spanning the entire
temporal frame of first America’s peopling, including currently
underrepresented regions of the continent.
Thirty-four unrelated males, 25 from Meso- and South America [20] and 9 from Asia, the Middle East and Europe [53, 55, 56], were high-depth re-sequenced for a large portion (3.7 Mb) of the MSY [27].
To increase the chance of identifying new phylogenetically informative
SNPs, the samples were selected taking into account their geographic
origin and Y-STR haplotypes. One hundred eighteen Hg Q MSY Native
American sequences were from the literature: 115 from modern samples [6, 22, 23, 30, 39, 57, 58, 59, 60] and 3 from ancient DNA specimens (“Saqqaq”, “Anzick-1” and “Kennewick”) [28, 40, 41, 61].
Phylogeny
Phylogenetic analyses were carried out on 152 male samples belonging to haplogroup Q (Additional file 1: Table S1) from 14 distinct geographic regions (Additional file 2: Figure S1). Two sequences belonging to Hg R1b, the sister clade of haplogroup Q, were also included in the analyses [26, 62].
Phylogeography
Geographic
distributions of the sub-haplogroups were evaluated by analysing 1549
modern Y chromosomes belonging to haplogroup Q: 711 Native Americans and
838 from Eurasia. Among these, 320 Native American and 89 Eurasian Y
chromosomes were sub-classified in this study, while the remaining were
from the literature or specialized websites (Additional file 8: Table S6).
Deep re-sequencing and sequence analysis
On
the whole, five regions of the X-degenerate portion of the MSY were
sequenced for a total of 3,768,982 bp for each Y chromosome. Of these,
1,495,512 bp were considered for the analysis, representing 5274 unique
fragments [27]. The employed capture design includes six protein-coding genes (RPS4Y1, ZFY, USP9Y, DDX3Y, UTY and TMSB4Y).
Library preparation, targeting, sequencing and alignment were performed
by BGI-Tech (Shenzhen, China) as previously described [27]. BAM files were visually inspected using Integrative Genomics Viewer (IGV) [63, 64]. Variants were filtered out using SAMtools [65] and BCFtools. GASVPro [66] and BreakDancer-v 1.1 [67]
were used to verify, a posteriori, that structural rearrangements did
not cause clustering of variants in short stretches of DNA. For all
positions found as variants in at least 1 of the samples considered, and
included in the above mentioned 5274 fragments, the read depth and the
quality score of consensus (QS) were investigated in the 34 re-sequenced
samples. Two main criteria were used to assess the validity of a
candidate mutation: QS > 90 and a difference between the depth and
the total number of reads for the two best bases ≤ 4. Variant calls with
QS = 99, depth ≥ 4 and a difference < 1 were considered true
mutations. Variant calls with QS ≤ 90 or QS > 90 but a difference
> 4 were indicated as not available (NA) to discard potential false
SNP calls, while calls with 90 ≤ QS ≤ 99 and 1 ≤ difference ≤ 4 were
manually inspected. Detailed information is provided in Additional file 17
Parsimony tree construction and time estimates
A
median-joining network and a maximum parsimony (MP) tree were
constructed on the basis of a list of variable positions per subject, by
using Network 5.0 [68] and MEGA6 [69],
respectively. The median-joining network provided a complete listing of
mutated positions along each branch and a precise count of inferred
recurrent mutations (.out file), which were re-checked and confirmed in
the original alignment files. The haplogroup Q phylogenetic tree and the
coalescent times of its sub-haplogroups were estimated through the
software BEAST 1.8.3 [70].
We employed a coalescent expansion growth model for the population
size, the radiocarbon dates of “Kennewick” (9.0 ± 0.1 ky), “Anzick-1”
(12.6 ± 0.1 ky) and “Saqqaq” (4.0 ± 1.0 ky) as tip dates, a strict clock
rate and rather flat priors for the current population size
(lognormal[3,10]) and for the ancestral/current population size ratio
(exponential[0.2]). Two runs of 20 million steps each, sampled every
10,000 steps, were performed.
Trees
reconstructed under this model were combined after discarding the first
200 generations of each replicate as burn-in using LogCombiner v.1.8.3 (http://beast.community/logcombiner). The trees were summarized using TreeAnnotator v.1.8.3 (http://beast.community/treeannotator),
and the results of divergence times were visualized on a maximum clade
credibility (MCC) tree produced using FigTree v.1.4.2 (http://tree.bio.ed.ac.uk/software/figtree).
The highest posterior densities (HPD), that collect the most probable
age distributions, were calculated for each TMRCA considered, taking
into consideration the effective sample size (ESS) parameter. Coalescent
time estimates were obtained by combining .log files after discarding
the first 2000 generations of each replicate as burn-in, and the results
were visualized in Tracer v1.6 [71].
Bayesian skyline plots (BSP) were generated with Tracer v1.6 [71]
using input from the files generated in the previous BEAST analyses. We
employed for the analysis a coalescent Bayesian skyline tree prior, a
GTR substitution model, and the radiocarbon dates of “Kennewick”
(9.0 ± 0.1 ky) and “Anzick-1” (12.6 ± 0.1 ky) as tip dates. Two
independent analyses of 20 million generations sampled every 10,000 were
computed. Convergence was confirmed by effective sample sizes over 200
for both runs.
Age from microsatellite variation
Ages based on microsatellite variation within binary haplogroups were defined by the methodology of Zhivotovsky et al. [72] as described in Karachanak et al. [73]. Microsatellite haplotypes are reported in Additional file 8:
Table S6. It is worth mentioning that ambiguities related to past
episodes of population history (e.g. size fluctuations, bottlenecks)
create inherent uncertainties in the calibration of the Y-STR molecular
clock; thus, the estimated ages of microsatellite variation should be
considered with caution.
Genotyping
Signature markers of 41 sub-haplogroups were defined (Additional file 6:
Table S4). The sequences surrounding each variant position were
downloaded from the UCSC DAS server. PCR primers were either designed
with Primer3 software and checked with Primer-BLAST or chosen from YSEQ
DNA shop (www.yseq.net). The genotyping was performed by Sanger sequencing or RFLP analysis.
We
are grateful to all the volunteers who generously participated in this
study and made this research possible. We also thank the editor and two
anonymous reviewers for their useful comments and suggestions.
Funding
This project received support
from the University of Pavia strategic theme “Towards a governance
model for international migration: an interdisciplinary and diachronic
perspective” (MIGRAT-IN-G) (to AA, LF, AO, OS, AT) and from the Italian
Ministry of Education, University and Research (MIUR): Dipartimenti di
Eccellenza Program (2018–2022), Dept. of Biology and Biotechnology “L.
Spallanzani”, University of Pavia (to AA, LF, AO, OS, AT).
Availability of data and materials
All data generated or
analysed during this study are included in this published article [and
its supplementary information files]. BAM files are available at the
European Nucleotide Archive (ENA) repository [https://www.ebi.ac.uk/ena] under the project PRJEB30504.
Authors’ contributions
VG,
AR and OS designed and supervised the experiments. VG, AR, LO, VB, GC
and MRC performed the analyses. AO, AA, AT and OS contributed
reagents/materials/analysis tools. VG, AR and OS wrote the paper. All
authors interpreted the data and read, revised and approved the final
version of the manuscript.
Ethics approval and consent to participate
All experimental procedures
and individual written informed consent, obtained from all donors, were
reviewed and approved by the Comité Nacional de Bioética de la
Investigación of Panama, by the Western Institutional Review Board,
Olympia, Washington (USA) and by the Ethics Committee for Clinical
Experimentation of the University of Pavia, Board minutes of October
5th, 2010.
Consent for publication
Not applicable.
Competing interests
The authors declare that they have no competing interests.
Publisher’s Note
Springer Nature remains neutral with regard to jurisdictional claims in published maps and institutional affiliations.
Open AccessThis article is distributed under the terms of the Creative Commons Attribution 4.0 International License (http://creativecommons.org/licenses/by/4.0/),
which permits unrestricted use, distribution, and reproduction in any
medium, provided you give appropriate credit to the original author(s)
and the source, provide a link to the Creative Commons license, and
indicate if changes were made. The Creative Commons Public Domain
Dedication waiver (http://creativecommons.org/publicdomain/zero/1.0/) applies to the data made available in this article, unless otherwise stated.
Mandryk
CAS, Josenhans H, Fedje DW, Mathewes RW. Late Quaternary
paleoenvironments of northwestern North America: implications for inland
versus coastal migration routes. Quat Sci Rev. 2001;20(1):301–14.Google Scholar
Nielsen
R, Akey JM, Jakobsson M, Pritchard JK, Tishkoff S, Willerslev E.
Tracing the peopling of the world through genomics. Nature.
2017;541(7637):302.PubMedPubMed CentralGoogle Scholar
Lesnek
AJ, Briner JP, Lindqvist C, Baichtal JF, Heaton TH. Deglaciation of the
Pacific coastal corridor directly preceded the human colonization of
the Americas. Sci Adv. 2018;4(5):eaar5040.PubMedPubMed CentralGoogle Scholar
Moreno-Mayar
JV, Potter BA, Vinner L, Steinrücken M, Rasmussen S, Terhorst J, Kamm
JA, Albrechtsen A, Malaspinas AS, Sikora M, et al. Terminal Pleistocene
Alaskan genome reveals first founding population of Native Americans.
Nature. 2018;553(7687):203–7.PubMedGoogle Scholar
Scheib
CL, Li H, Desai T, Link V, Kendall C, Dewar G, Griffith PW, Mörseburg
A, Johnson JR, Potter A, et al. Ancient human parallel lineages within
North America contributed to a coastal expansion. Science.
2018;360(6392):1024–7.PubMedGoogle Scholar
Raghavan
M, Steinrücken M, Harris K, Schiffels S, Rasmussen S, DeGiorgio M,
Albrechtsen A, Valdiosera C, Ávila-Arcos MC, Malaspinas AS, et al.
POPULATION GENETICS. Genomic evidence for the Pleistocene and recent
population history of Native Americans. Science. 2015;349(6250):aab3884.PubMedPubMed CentralGoogle Scholar
Bandelt
HJ, Herrnstadt C, Yao YG, Kong QP, Kivisild T, Rengo C, Scozzari R,
Richards M, Villems R, Macaulay V, et al. Identification of Native
American founder mtDNAs through the analysis of complete mtDNA
sequences: some caveats. Ann Hum Genet. 2003;67(Pt 6):512–24.PubMedGoogle Scholar
Achilli
A, Perego UA, Bravi CM, Coble MD, Kong QP, Woodward SR, Salas A,
Torroni A, Bandelt HJ. The phylogeny of the four Pan-American MtDNA
haplogroups: implications for evolutionary and disease studies. PLoS
One. 2008;3(3):e1764.PubMedPubMed CentralGoogle Scholar
Perego
UA, Angerhofer N, Pala M, Olivieri A, Lancioni H, Hooshiar Kashani B,
Carossa V, Ekins JE, Gómez-Carballa A, Huber G, et al. The initial
peopling of the Americas: a growing number of founding mitochondrial
genomes from Beringia. Genome Res. 2010;20(9):1174–9.PubMedPubMed CentralGoogle Scholar
Perego
UA, Achilli A, Angerhofer N, Accetturo M, Pala M, Olivieri A, Hooshiar
Kashani B, Ritchie KH, Scozzari R, Kong QP, et al. Distinctive
Paleo-Indian migration routes from Beringia marked by two rare mtDNA
haplogroups. Curr Biol. 2009;19(1):1–8.PubMedGoogle Scholar
Achilli
A, Perego UA, Lancioni H, Olivieri A, Gandini F, Hooshiar Kashani B,
Battaglia V, Grugni V, Angerhofer N, Rogers MP, et al. Reconciling
migration models to the Americas with the variation of North American
native mitogenomes. Proc Natl Acad Sci U S A. 2013;110(35):14308–13.PubMedPubMed CentralGoogle Scholar
Tamm
E, Kivisild T, Reidla M, Metspalu M, Smith DG, Mulligan CJ, Bravi CM,
Rickards O, Martinez-Labarga C, Khusnutdinova EK, et al. Beringian
standstill and spread of Native American founders. PLoS One.
2007;2(9):e829.PubMedPubMed CentralGoogle Scholar
O’Rourke DH, Raff JA. The human genetic history of the Americas: the final frontier. Curr Biol. 2010;20(4):R202–7.PubMedGoogle Scholar
Hooshiar
Kashani B, Perego UA, Olivieri A, Angerhofer N, Gandini F, Carossa V,
Lancioni H, Semino O, Woodward SR, Achilli A, et al. Mitochondrial
haplogroup C4c: a rare lineage entering America through the ice-free
corridor? Am J Phys Anthropol. 2012;147(1):35–9.PubMedGoogle Scholar
Brandini
S, Bergamaschi P, Cerna MF, Gandini F, Bastaroli F, Bertolini E, Cereda
C, Ferretti L, Gómez-Carballa A, Battaglia V, et al. The Paleo-Indian
entry into South America according to mitogenomes. Mol Biol Evol.
2018;35(2):299–311.PubMedGoogle Scholar
de
Saint PM, Gandini F, Perego UA, Bodner M, Gómez-Carballa A, Corach D,
Angerhofer N, Woodward SR, Semino O, Salas A, et al. Arrival of
Paleo-Indians to the southern cone of South America: new clues from
mitogenomes. PLoS One. 2012;7(12):e51311.Google Scholar
Achilli A, Olivieri A, Semino O, Torroni A. Ancient human genomes-keys to understanding our past. Science. 2018;360(6392):964–5.PubMedGoogle Scholar
Zegura
SL, Karafet TM, Zhivotovsky LA, Hammer MF. High-resolution SNPs and
microsatellite haplotypes point to a single, recent entry of Native
American Y chromosomes into the Americas. Mol Biol Evol.
2004;21(1):164–75.PubMedGoogle Scholar
Dulik
MC, Owings AC, Gaieski JB, Vilar MG, Andre A, Lennie C, Mackenzie MA,
Kritsch I, Snowshoe S, Wright R, et al. Y-chromosome analysis reveals
genetic divergence and new founding native lineages in Athapaskan- and
Eskimoan-speaking populations. Proc Natl Acad Sci U S A.
2012;109(22):8471–6.PubMedPubMed CentralGoogle Scholar
Battaglia
V, Grugni V, Perego UA, Angerhofer N, Gomez-Palmieri JE, Woodward SR,
Achilli A, Myres N, Torroni A, Semino O. The first peopling of South
America: new evidence from Y-chromosome haplogroup Q. PLoS One.
2013;8(8):e71390.PubMedPubMed CentralGoogle Scholar
Grugni
V, Battaglia V, Perego UA, Raveane A, Lancioni H, Olivieri A, Ferretti
L, Woodward SR, Pascale JM, Cooke R, et al. Exploring the Y chromosomal
ancestry of modern Panamanians. PLoS One. 2015;10(12):e0144223.PubMedPubMed CentralGoogle Scholar
Karmin
M, Saag L, Vicente M, Wilson Sayres MA, Järve M, Talas UG, Rootsi S,
Ilumäe AM, Mägi R, Mitt M, et al. A recent bottleneck of Y chromosome
diversity coincides with a global change in culture. Genome Res.
2015;25(4):459–66.PubMedPubMed CentralGoogle Scholar
Poznik
GD, Henn BM, Yee M-C, Sliwerska E, Euskirchen GM, Lin AA, Snyder M,
Quintana-Murci L, Kidd JM, Underhill PA. Sequencing Y chromosomes
resolves discrepancy in time to common ancestor of males versus females.
Science. 2013;341(6145):562–5.PubMedPubMed CentralGoogle Scholar
Wong
EH, Khrunin A, Nichols L, Pushkarev D, Khokhrin D, Verbenko D, Evgrafov
O, Knowles J, Novembre J, Limborska S, et al. Reconstructing genetic
history of Siberian and Northeastern European populations. Genome Res.
2017;27(1):1–14.PubMedPubMed CentralGoogle Scholar
Jota
MS, Lacerda DR, Sandoval JR, Vieira PP, Ohasi D, Santos-Júnior JE,
Acosta O, Cuellar C, Revollo S, Paz-Y-Miño C, et al. New native South
American Y chromosome lineages. J Hum Genet. 2016;61(7):593–603.PubMedGoogle Scholar
Trombetta
B, D’Atanasio E, Massaia A, Myres NM, Scozzari R, Cruciani F,
Novelletto A. Regional differences in the accumulation of SNPs on the
male-specific portion of the human Y chromosome replicate autosomal
patterns: implications for genetic dating. PLoS One.
2015;10(7):e0134646.PubMedPubMed CentralGoogle Scholar
Scozzari
R, Massaia A, Trombetta B, Bellusci G, Myres NM, Novelletto A, Cruciani
F. An unbiased resource of novel SNP markers provides a new chronology
for the human Y chromosome and reveals a deep phylogenetic structure in
Africa. Genome Res. 2014;24(3):535–44.PubMedPubMed CentralGoogle Scholar
Rasmussen
M, Li Y, Lindgreen S, Pedersen JS, Albrechtsen A, Moltke I, Metspalu M,
Metspalu E, Kivisild T, Gupta R, et al. Ancient human genome sequence
of an extinct Palaeo-Eskimo. Nature. 2010;463(7282):757–62.PubMedPubMed CentralGoogle Scholar
Poznik
GD, Xue Y, Mendez FL, Willems TF, Massaia A, Wilson Sayres MA, Ayub Q,
McCarthy SA, Narechania A, Kashin S, et al. Punctuated bursts in human
male demography inferred from 1,244 worldwide Y-chromosome sequences.
Nat Genet. 2016;48(6):593–9.PubMedPubMed CentralGoogle Scholar
Balanovsky
O, Gurianov V, Zaporozhchenko V, Balaganskaya O, Urasin V, Zhabagin M,
Grugni V, Canada R, Al-Zahery N, Raveane A, et al. Phylogeography of
human Y-chromosome haplogroup Q3-L275 from an academic/citizen science
collaboration. BMC Evol Biol. 2017;17(Suppl 1):18.PubMedPubMed CentralGoogle Scholar
Olofsson
JK, Pereira V, Børsting C, Morling N. Peopling of the North Circumpolar
Region--insights from Y chromosome STR and SNP typing of Greenlanders.
PLoS One. 2015;10(1):e0116573.PubMedPubMed CentralGoogle Scholar
Zhong
H, Shi H, Qi XB, Duan ZY, Tan PP, Jin L, Su B, Ma RZ. Extended Y
chromosome investigation suggests postglacial migrations of modern
humans into East Asia via the northern route. Mol Biol Evol.
2011;28(1):717–27.PubMedGoogle Scholar
Flegontov
P, Altinisik NE, Changma IP, Vajda EJ, Krause J, Schiffels S. Na-Dene
populations descend from the Paleo-Eskimo migration into America. In:
Cold Spring Harbor Laboratory; 2018.Google Scholar
Keller
A, Graefen A, Ball M, Matzas M, Boisguerin V, Maixner F, Leidinger P,
Backes C, Khairat R, Forster M, et al. New insights into the Tyrolean
Iceman’s origin and phenotype as inferred by whole-genome sequencing.
Nat Commun. 2012;3:698.PubMedGoogle Scholar
Olivieri
A, Achilli A, Pala M, Battaglia V, Fornarino S, Al-Zahery N, Scozzari
R, Cruciani F, Behar DM, Dugoujon JM, et al. The mtDNA legacy of the
Levantine Early Upper Palaeolithic in Africa. Science.
2006;314(5806):1767–70.PubMedGoogle Scholar
Olivieri
A, Sidore C, Achilli A, Angius A, Posth C, Furtwängler A, Brandini S,
Capodiferro MR, Gandini F, Zoledziewska M, et al. Mitogenome diversity
in Sardinians: a genetic window onto an island’s past. Mol Biol Evol.
2017;34(5):1230–9.PubMedPubMed CentralGoogle Scholar
Dulik
MC, Zhadanov SI, Osipova LP, Askapuli A, Gau L, Gokcumen O, Rubinstein
S, Schurr TG. Mitochondrial DNA and Y chromosome variation provides
evidence for a recent common ancestry between Native Americans and
indigenous Altaians. Am J Hum Genet. 2012;90(3):573.PubMed CentralGoogle Scholar
Moreno-Mayar
JV, Vinner L, de Barros DP, de la Fuente C, Chan J, Spence JP,
Allentoft ME, Vimala T, Racimo F, Pinotti T, et al. Early human
dispersals within the Americas. Science. 2018; [Epub ahead of print].Google Scholar
Hallast
P, Batini C, Zadik D, Maisano Delser P, Wetton JH, Arroyo-Pardo E,
Cavalleri GL, de Knijff P, Destro Bisol G, Dupuy BM, et al. The
Y-chromosome tree bursts into leaf: 13,000 high-confidence SNPs covering
the majority of known clades. Mol Biol Evol. 2015;32(3):661–73.PubMedGoogle Scholar
Rasmussen
M, Anzick SL, Waters MR, Skoglund P, DeGiorgio M, Stafford TW,
Rasmussen S, Moltke I, Albrechtsen A, Doyle SM, et al. The genome of a
Late Pleistocene human from a Clovis burial site in Western Montana.
Nature. 2014;506(7487):225–9.PubMedPubMed CentralGoogle Scholar
Rasmussen
M, Sikora M, Albrechtsen A, Korneliussen TS, Moreno-Mayar JV, Poznik
GD, Zollikofer CP, Ponce de León MS, Allentoft ME, Moltke I, et al. The
ancestry and affiliations of Kennewick Man. Nature.
2015;523(7561):455–8.PubMedPubMed CentralGoogle Scholar
Posth
C, Nakatsuka N, Lazaridis I, Skoglund P, Mallick S, Lamnidis TC,
Rohland N, Nägele K, Adamski N, Bertolini E, et al. Reconstructing the
deep population history of Central and South America. Cell.
2018;175(5):1185–97.PubMedPubMed CentralGoogle Scholar
Dillehay
TD, Goodbred S, Pino M, Vásquez Sánchez VF, Tham TR, Adovasio J,
Collins MB, Netherly PJ, Hastorf CA, Chiou KL, et al. Simple
technologies and diverse food strategies of the Late Pleistocene and
Early Holocene at Huaca Prieta, Coastal Peru. Sci Adv.
2017;3(5):e1602778.PubMedPubMed CentralGoogle Scholar
Clapperton
C. Nature of environmental changes in South America at the Last Glacial
Maximum. Palaeogeogr Palaeocl. 1993;101:189–208.Google Scholar
Scliar
MO, Gouveia MH, Benazzo A, Ghirotto S, Fagundes NJ, Leal TP, Magalhães
WC, Pereira L, Rodrigues MR, Soares-Souza GB, et al. Bayesian inferences
suggest that Amazon Yunga Natives diverged from Andeans less than 5000
ybp: implications for South American prehistory. BMC Evol Biol.
2014;14:174.PubMedPubMed CentralGoogle Scholar
Goldberg
A, Mychajliw AM, Hadly EA. Post-invasion demography of prehistoric
humans in South America. Nature. 2016;532(7598):232–5.PubMedGoogle Scholar
Staller J, Tykot R, Benz BF. Histories of maize in Mesoamerica: multidisciplinary approaches; 2016.Google Scholar
Cavalli-Sforza LL, Menozzi P, Piazza A. The history and geography of human genes. Princeton: Princeton University Press; 1994. Google Scholar
Reich
D, Patterson N, Campbell D, Tandon A, Mazieres S, Ray N, Parra MV,
Rojas W, Duque C, Mesa N, et al. Reconstructing Native American
population history. Nature. 2012;488(7411):370–4.PubMedPubMed CentralGoogle Scholar
Skoglund
P, Mallick S, Bortolini MC, Chennagiri N, Hünemeier T, Petzl-Erler ML,
Salzano FM, Patterson N, Reich D. Genetic evidence for two founding
populations of the Americas. Nature. 2015;525(7567):104–8.PubMedPubMed CentralGoogle Scholar
Hoffecker
JF, Elias Scott A, O’Rourke DH, Scott GR, Bigelow NH. Beringia and the
global dispersal of modern humans. Evol Anthropol. 2016;25(2):64–78.PubMedGoogle Scholar
de
la Fuente C, Ávila-Arcos MC, Galimany J, Carpenter ML, Homburger JR,
Blanco A, Contreras P, Cruz Dávalos D, Reyes O, San Roman M, et al.
Genomic insights into the origin and diversification of late maritime
hunter-gatherers from the Chilean Patagonia. Proc Natl Acad Sci U S A.
2018;115(17):E4006–12.PubMedPubMed CentralGoogle Scholar
Grugni
V, Battaglia V, Hooshiar Kashani B, Parolo S, Al-Zahery N, Achilli A,
Olivieri A, Gandini F, Houshmand M, Sanati MH, et al. Ancient migratory
events in the Middle East: new clues from the Y-chromosome variation of
modern Iranians. PLoS One. 2012;7(7):e41252.PubMedPubMed CentralGoogle Scholar
Di
Cristofaro J, Pennarun E, Mazières S, Myres NM, Lin AA, Temori SA,
Metspalu M, Metspalu E, Witzel M, King RJ, et al. Afghan Hindu Kush:
where Eurasian sub-continent gene flows converge. PLoS One.
2013;8(10):e76748.PubMedPubMed CentralGoogle Scholar
Battaglia
V, Fornarino S, Al-Zahery N, Olivieri A, Pala M, Myres NM, King RJ,
Rootsi S, Marjanovic D, Primorac D, et al. Y-chromosomal evidence of the
cultural diffusion of agriculture in Southeast Europe. Eur J Hum Genet.
2009;17(6):820–30.PubMedGoogle Scholar
Fornarino
S, Pala M, Battaglia V, Maranta R, Achilli A, Modiano G, Torroni A,
Semino O, Santachiara-Benerecetti SA. Mitochondrial and Y-chromosome
diversity of the Tharus (Nepal): a reservoir of genetic variation. BMC
Evol Biol. 2009;9:154.PubMedPubMed CentralGoogle Scholar
Zhou
D, Udpa N, Ronen R, Stobdan T, Liang J, Appenzeller O, Zhao HW, Yin Y,
Du Y, Guo L, et al. Whole-genome sequencing uncovers the genetic basis
of chronic mountain sickness in Andean highlanders. Am J Hum Genet.
2013;93(3):452–62.PubMedPubMed CentralGoogle Scholar
Raghavan
M, Skoglund P, Graf KE, Metspalu M, Albrechtsen A, Moltke I, Rasmussen
S, Stafford TW, Orlando L, Metspalu E, et al. Upper Palaeolithic
Siberian genome reveals dual ancestry of Native Americans. Nature.
2014;505(7481):87–91.PubMedGoogle Scholar
Mallick
S, Li H, Lipson M, Mathieson I, Gymrek M, Racimo F, Zhao M, Chennagiri
N, Nordenfelt S, Tandon A, et al. The Simons Genome Diversity Project:
300 genomes from 142 diverse populations. Nature. 2016;538(7624):201–6.PubMedPubMed CentralGoogle Scholar
Prüfer
K, Racimo F, Patterson N, Jay F, Sankararaman S, Sawyer S, Heinze A,
Renaud G, Sudmant PH, de Filippo C, et al. The complete genome sequence
of a Neanderthal from the Altai Mountains. Nature. 2014;505(7481):43–9.PubMedPubMed CentralGoogle Scholar
The Genomes Project C. A global reference for human genetic variation. Nature. 2015;526:68.Google Scholar
Underhill
PA, Poznik GD, Rootsi S, Järve M, Lin AA, Wang J, Passarelli B, Kanbar
J, Myres NM, King RJ, et al. The phylogenetic and geographic structure
of Y-chromosome haplogroup R1a. Eur J Hum Genet. 2015;23(1):124–31.PubMedGoogle Scholar
Thorvaldsdóttir
H, Robinson JT, Mesirov JP. Integrative Genomics Viewer (IGV):
high-performance genomics data visualization and exploration. Brief
Bioinform. 2013;14(2):178–92.PubMedGoogle Scholar
Li
H, Handsaker B, Wysoker A, Fennell T, Ruan J, Homer N, Marth G,
Abecasis G, Durbin R, Subgroup GPDP. The Sequence Alignment/Map format
and SAMtools. Bioinformatics. 2009;25(16):2078–9.PubMedPubMed CentralGoogle Scholar
Sindi
SS, Onal S, Peng LC, Wu HT, Raphael BJ. An integrative probabilistic
model for identification of structural variation in sequencing data.
Genome Biol. 2012;13(3):R22.PubMedPubMed CentralGoogle Scholar
Chen
K, Wallis JW, McLellan MD, Larson DE, Kalicki JM, Pohl CS, McGrath SD,
Wendl MC, Zhang Q, Locke DP, et al. BreakDancer: an algorithm for
high-resolution mapping of genomic structural variation. Nat Methods.
2009;6(9):677–81.PubMedPubMed CentralGoogle Scholar
Bandelt HJ, Forster P, Röhl A. Median-joining networks for inferring intraspecific phylogenies. Mol Biol Evol. 1999;16(1):37–48.PubMedGoogle Scholar
Tamura
K, Stecher G, Peterson D, Filipski A, Kumar S. MEGA6: Molecular
Evolutionary Genetics Analysis version 6.0. Mol Biol Evol.
2013;30(12):2725–9.PubMedPubMed CentralGoogle Scholar
Drummond AJ, Rambaut A. BEAST: Bayesian evolutionary analysis by sampling trees. BMC Evol Biol. 2007;7:214.PubMedPubMed CentralGoogle Scholar
Rambaut
A, Drummond AJ, Xie D, Baele G, Suchard MA. Posterior summarisation in
Bayesian phylogenetics using Tracer 1.7. Syst Biol. 2018;67(5):901–4. https://doi.org/10.1093/sysbio/syy032.
Zhivotovsky
LA, Underhill PA, Cinnioglu C, Kayser M, Morar B, Kivisild T, Scozzari
R, Cruciani F, Destro-Bisol G, Spedini G, et al. The effective mutation
rate at Y chromosome short tandem repeats, with application to human
population-divergence time. Am J Hum Genet. 2004;74(1):50–61.PubMedGoogle Scholar
Nenhum comentário:
Postar um comentário
Observação: somente um membro deste blog pode postar um comentário.
Nenhum comentário:
Postar um comentário
Observação: somente um membro deste blog pode postar um comentário.