Evolutionary trees can’t reveal speciation and extinction rates
Evolutionary-tree diagrams, which show the branching
relationships between species, are widely used to estimate the rates at
which new species arise and existing ones become extinct. New work
casts doubt on this approach.
Scientists often want to make inferences
about what the biological past was like, and how that past gave rise to
the present, because doing so allows them to understand the processes
that drive evolution. But, writing in Nature, Louca and Pennell1 challenge a major aspect of that enterprise.
Specifically, their work regards the issue of estimating
past rates of speciation and extinction, which are, respectively, the
rates at which new species arise and existing species go extinct. These
rates determine the number of contemporary species of various forms.
There are, for instance, around 6,600 species of songbird (passerines),
which constitute more than half of all existing bird species, and we
might therefore be tempted to say that songbirds have a high rate of
speciation in comparison with that of other birds. But it’s also
possible to speculate that they have a low extinction rate. Louca and
Pennell show that the uncertainty is even worse than this: not only can
we not estimate these two rates, but also there is an infinite number of
different sets of these two parameters that are equally good at
describing any particular outcome, such as the number of species of
contemporary songbird.
Because fossils are scarce or non-existent
for the vast majority of species, evolutionary scientists instead
estimate speciation and extinction rates from phylogenies — tree
diagrams that describe the patterns of descent among a group of
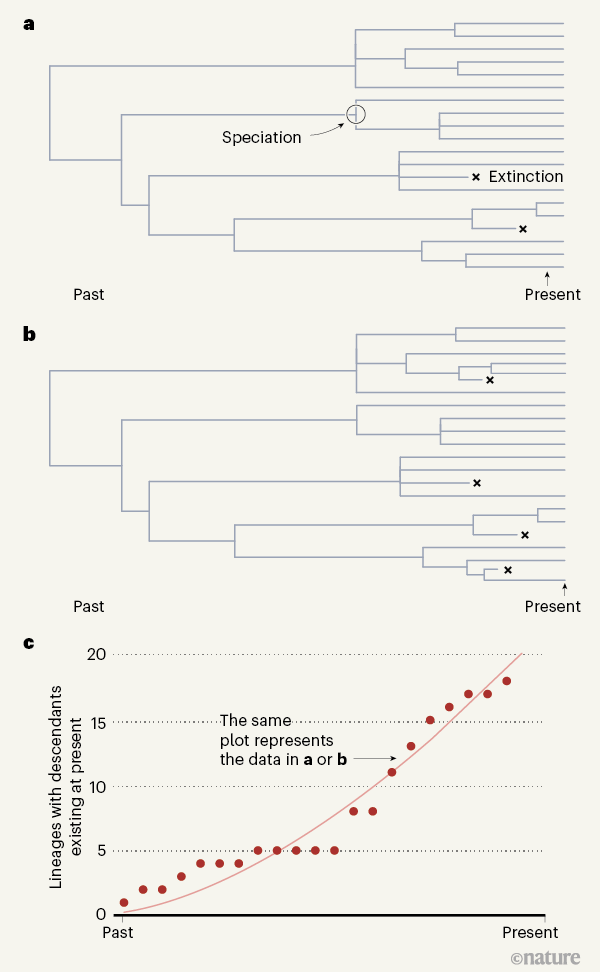
contemporary species (Fig. 1a,b). For any such phylogeny, it is easy to
construct what is termed a lineage-through-time plot; this records the
cumulative number of lineages up to that point in time on the tree that
will eventually leave one or more living descendent species (Fig. 1c).
The slope of the curve fitted to such a plot, often denoted by λ, is the net speciation rate. This is equal to the difference between the rate of speciation, termed b (or birth), and the rate of extinction, termed d (or death). It is described by the equation λ = b – d.
Especificamente, seu trabalho trata da questão de estimar taxas passadas de especiação e extinção, que são, respectivamente, as taxas nas quais novas espécies surgem e espécies existentes se extinguem. Essas taxas determinam o número de espécies contemporâneas de várias formas. Existem, por exemplo, cerca de 6.600 espécies de aves canoras (passerinas), que constituem mais da metade de todas as espécies de aves existentes, e, portanto, podemos ficar tentados a dizer que as aves canoras têm uma alta taxa de especiação em comparação com outras aves. Mas também é possível especular que eles têm uma baixa taxa de extinção. Louca e Pennell mostram que a incerteza é ainda pior do que isso: não apenas não podemos estimar essas duas taxas, mas também há um número infinito de conjuntos diferentes desses dois parâmetros que são igualmente bons para descrever qualquer resultado em particular, como o número de espécies de aves canoras contemporâneas.
Como os fósseis são escassos ou inexistentes para a grande maioria das espécies, os cientistas evolucionistas estimam as taxas de especiação e extinção das filogenias - diagramas de árvores que descrevem os padrões de descida entre um grupo de espécies contemporâneas (Fig. 1a, b). Para qualquer filogenia desse tipo, é fácil construir o que é chamado de gráfico de linhagem através do tempo; isso registra o número acumulado de linhagens até aquele momento na árvore que eventualmente deixará uma ou mais espécies descendentes vivas (Fig. 1c). A inclinação da curva ajustada a esse gráfico, frequentemente indicada por λ, é a taxa líquida de especiação. Isso é igual à diferença entre a taxa de especiação, denominada b (ou nascimento), e a taxa de extinção, denominada d (ou morte). É descrito pela equação λ = b - d.
Figure 1 | Assessing evolutionary histories. Louca and Pennell1
raise questions about a standard approach to estimating past rates of
species formation (speciation) and extinction that uses data from a
lineage-through-time plot. The number of species in the present depends
on how speciation and extinction rates varied over time in the past.
Using mathematical modelling, the authors reveal that an infinite number
of pairs of speciation and extinction rates could give rise to any
given outcome, and it is thus unclear how to determine the correct
rates. a, b, Examples of known extinctions are rare, and
are shown in these hypothetical tree diagrams only to illustrate how
different rates of extinction (and different speciation rates) can yield
the same lineage-through-time plot. c, Information taken from a
tree diagram can be represented in a lineage-through-time plot as shown.
Red dots indicate the number of lineages at a given time that gave rise
to lineages existing in the present. The slope of the curve equals the
speciation rate minus the extinction rate. This plot is valid for both
trees even though they have different speciation and extinction rates.
This underscores the authors’ demonstration that many different data
inputs can give identical lineage-through-time plots.
However, it is known that a difficulty arises in estimating b and d,
because if all that is available is the number of species that have
survived to the present, such as our 6,600 songbirds, any pair of b and d that returns the same value of λ
will produce an identical lineage-through-time curve, and there is an
infinite number of these pairs. In fact, it turns out that for the
simple case of estimating b – d, such as described here, a
feature of the shape of the lineage-through-time curve can be exploited
to estimate the rate of extinction, and then the rate of speciation can
be found by subtraction2.
But to do so requires making the assumption that both of these rates
are constant throughout the entire time span of the tree, when instead
they almost certainly vary between the different branches (lineages) of
the phylogeny, and through time.
This is where Louca and Pennell
step in, because the novelty and mathematical sophistication of their
work lie in showing that we cannot estimate these ‘time-varying’
speciation and extinction rates. The authors invoke earlier work3
that defines the existence of a tree’s ‘deterministic’
lineage-through-time curve: this is a set of differential equations
(equations describing rates of change) that fully determine the number
of lineages in a tree at any given time. Louca and Pennell’s key result
is then to show that there is an infinite number of alternative sets of
time-varying speciation–extinction rates that yield the same number of
lineages at any given time as does the deterministic
lineage-through-time curve. They further show that the most probable
estimates of the two rates (calculated by maximum-likelihood methods) do
not necessarily identify the correct underlying model — as demonstrated
by an analysis of hypothetical cases for which the true time-varying
speciation–extinction rates are known.
Even worse for those who want to use the rates of speciation
and extinction to study evolution, the possible alternative scenarios
of time-varying speciation and extinction rates that are consistent with
the deterministic lineage-through-time model often differ
qualitatively. For example, the authors show that a phylogeny of
approximately 80,000 species of seed plant is equally well described by
speciation and extinction rates that both gradually increase through
time or that both gradually decrease through time. Other scenarios,
including rates that vary wildly with time, provide equally good
descriptions of the numbers of lineages through time as derived from the
deterministic lineage-through-time model.
Louca and Pennell’s
conclusions will be dispiriting to evolutionary scientists who are
looking for a link between past levels of speciation and extinction and
historical climate change or other environmental events, or who want to
test ideas about what features of a species — such as diet, mating
system or the length of a generation — might be used to predict
speciation and extinction rates4.
The limitations that Louca and Pennell have identified for estimating
speciation and extinction rates do not go away as the size of the
phylogenetic tree increases. Nor do other common features of trees
provide much help: for example, if a group of species has never suffered
any extinctions, estimating their speciation rate would be
straightforward. But this is rare, and unlikely to be known in advance.
Having abundant fossils could help, because they provide evidence needed
to estimate extinction rates; however, fossils are seldom abundant. We
can make assumptions about how speciation and extinction might vary with
each other, through time, or with the number of species, but these
assumptions are being made about the things that we would like to
estimate.
Amid this epistemological carnage regarding what we can
possibly know, the authors helpfully offer some consolation by showing
that it is possible to estimate a parameter they call the pulled
speciation rate, or λp. This measures the rate of
change (the slope of the curve) of the deterministic model of the
lineage-through-time plot. The pulled speciation rate can be compared
between lineages, or at different times, and might be useful for
understanding the processes that gave rise to the species that are alive
today, even if not necessarily providing information about those
species that didn’t make it.
And this aspect — the ones that
became extinct — is the deeper lesson of Louca and Pennell’s work.
Without fossils, all evolutionary scientists, whether studying
speciation and extinction or attempting to reconstruct the features of
distant ancestors, need to be aware that the evolutionary processes they
identify are those that operated in the species that would survive and
eventually leave descendants in the present. We can’t be sure what was
going on in those that went extinct. It is the evolutionary version of
the observation that history is written by the victors. The supreme
irony of this predicament is that Charles Darwin’s idea about the
survival of the fittest, the story that we want to understand, by its
very nature renders elusive some of the key components needed to study
it.
doi: 10.1038/d41586-020-01021-4
References
1.
Louca, S. & Pennell, M. W. Nature https://doi.org/10.1038/s41586-020-2176-1 (2020).

Nenhum comentário:
Postar um comentário
Observação: somente um membro deste blog pode postar um comentário.