Se a orientação da hidroxiapatita (AH) em amostras ósseas fossilizadas pode ser recuperada de forma não destrutiva e usada para determinar o arranjo da matriz óssea e a localização das ligações musculares (ênteses), é uma questão de alta relevância para a paleontologia, pois facilita compreensão da (micro-) anatomia de espécies extintas sem dano aos preciosos espécimes fósseis. Aqui, nós relatamos estudos de duas amostras de ossos fósseis, especificamente a tíbia de um tetrápode de 300 milhões de anos, Discosauriscus austriacus, e o úmero de um peixe com nadadeiras lobadas de 370 milhões de anos, Eusthenopteron foordi, usando XRD. -CT - uma combinação de difração de raios X (XRD) e tomografia computadoriImagens 3D reconstruídas mostrando as distribuições minerais espaciais e a orientação local de HA foram obtidas. Para Discosauriscus austriacus, os detalhes dos anexos musculares podem ser discernidos. Para Eusthenopteron foordi, os detalhes grosseiros da orientação preferencial de HA foram deduzidos usando três conjuntos de dados tomográficos obtidos com eixos de rotação orientados ortogonalmente. Para ambas as amostras, o HA na matriz do osso exibiu orientação preferida, com o eixo c da célula unitária dos cristalitos de HA tendendo a ser paralelo à superfície do osso. Em resumo, demonstramos que o XRD-CT combinado com um procedimento de reconstrução intuitivo está se tornando uma ferramenta poderosa para o estudo de amostras paleontológicas.zada (CT). Reconstructed 3D images showing the spatial mineral
distributions and the local orientation of HA were obtained. For Discosauriscus austriacus, details of the muscle attachments could be discerned. For Eusthenopteron foordi,
the gross details of the preferred orientation of HA were deduced using
three tomographic datasets obtained with orthogonally oriented rotation
axes. For both samples, the HA in the bone matrix exhibited preferred
orientation, with the unit cell c-axis of the HA crystallites
tending to be parallel with the bone surface. In summary, we have
demonstrated that XRD-CT combined with an intuitive reconstruction
procedure is becoming a powerful tool for studying palaeontological
samples.
Introduction
A tomografia computadorizada (TC) baseada em contraste de atenuação e / ou contraste de fase é cada vez mais utilizada em paleontologia, devido à sua capacidade de fornecer, de forma não destrutiva, imagens 3D de materiais opacos1,2. Em raros casos, os músculos são preservados, permitindo que sua estrutura seja investigada diretamente3. A situação usual é, no entanto, que os tecidos moles não são preservados, e a musculatura de animais extintos só pode ser recuperada da geometria e composição do osso onde os músculos estavam ligados. Nos vertebrados existentes, os músculos se fixam aos ossos por meio de fibras de colágeno inseridas na matriz óssea para formar ligações musculares (ênteses) 4,5..
As fibras colágenas musculares podem ser diferenciadas das fibras colágenas da matriz óssea com base em sua orientação, pois as fibras colágenas do músculo são embutidas na matriz óssea com um ângulo variando de 0 a 60 graus em relação à superfície óssea normal6,7. As fibras de colágeno são estruturas positivamente birrefringentes e sua orientação pode ser revelada usando luz polarizada8. Como as fibras musculares são progressivamente embebidas na matriz óssea durante o desenvolvimento do animal, elas também são mineralizadas9. Os cristalitos de hidroxiapatita (HA) associados são negativamente birrefringentes, e sua orientação também pode ser revelada usando luz polarizada em espécimes fisicamente existentes extintos e extintos10.
Studies
done by transmission electron microscopy (TEM) of bone from extant
animals have shown that the HA crystallites are platelet-shaped and
arranged in parallel layers aligned along the collagen fibre axis11.
Research indicates that the diagenesis, i.e. the process in which
biological materials degrade during fossilisation, alters the morphology
of HA in such a way that needle-shaped crystallites in addition to
platelet-shaped crystallites can be found11. However, there is strong evidence that the orientation of the HA crystallites is preserved during fossilisation12,13, which opens for investigating the bone microstructure and associated soft tissues, such as muscles in fossils6,7.
Until
recently, reconstructions of fossil musculature have been based mainly
on the interpretation of muscle scars at the surface of fossil bones14,15. Polarised light micrography6 and (propagation-based) phase contrast micro-CT7
have been used to map muscle insertions on fossilised bone samples.
However, they both have important limitations. In order to extract the
information of HA orientation using polarised microscopy, the sample
needs to be sectioned into thin slices, and thus destroyed. Conventional
CT has insufficient resolution to study the nanoscale mineral
orientation. High-resolution micro- or nano-CT, even if it may reach the
appropriate resolution for studying crystallite shapes, has a limited
field of view of about 1 mm at high resolution, which is insufficient
for getting an overview of the muscle attachments in vertebrate fossil
bones16. New approaches are therefore desired to extract the 3D orientation of the HA without damaging the fossils.
Bragg
peaks seen in X-ray diffraction (XRD) contain information about
atomic-scale crystal structures including the orientation of the crystal
lattice17.
XRD allows information to be gathered about the presence and
concentration of different materials, as well as their morphology on the
micro and nanoscale. These facts have made XRD the undisputed technique
for resolving crystal structures, and for determining how materials
respond to various external stimuli under in-situ conditions17.
XRD is non-destructive, where other relevant techniques like
transmission electron microscopy (TEM) or scanning electron microscopy
(SEM) require destructive sample sectioning12,18. Fossil samples have previously been studied with XRD, however limited to powder diffraction19,20,
which does not allow spatially resolved information about the mineral
concentration nor crystallite orientation to be obtained.
Novas fontes de raios-X, detectores e ótica, combinadas com o aumento do poder computacional, levaram a uma série de novos métodos de dispersão e imagem permitindo que informações estruturais resolvidas espacialmente fossem obtidas de amostras macroscópicas em massa usando CT de raios X com mecanismos de contraste não convencionais. Exemplos desses métodos são a tomografia computadorizada por espalhamento de raios X em pequenos ângulos (SAXS-CT) 21,22, a imagem difrativa coerente (CDI) 23,24,25 e a fotomicrografia26,27,28. Recentemente, várias abordagens para a resolução espacial de orientações de materiais, conhecidas como imagens vetoriais de raios X16,29,30, foram desenvolvidas, recentemente, mesmo com contras magnéticos.t31.
The
combination of XRD and computed tomography (CT), often referred to as
XRD-CT, denotes an emerging family of techniques where the information
obtained from the diffracted radiation, rather than beam attenuation, is
used to form contrast for 3D tomographic reconstructions32.
XRD-CT is not yet commonly available for routine studies, but the
technique is increasingly used in the materials sciences. The first
publication using XRD-CT dates back to the late 1980s32,
but because of the increased computational power and fast read-out
low-noise detectors available today, more data can now be acquired and
processed, which allows larger sample volumes to be measured and higher
resolution images to be acquired. The fact that orientation information
is contained in the scattering signal, is the salient feature that opens
for 3D reconstructions of material orientation. Several
publications employing the XRD-CT technique already exist, and
frequently reported limitations include that the samples need to either
consist of large crystallites compared to the resolved voxel size33,34, or a large number of isotropically oriented crystallites must be contained in each voxel volume35.
In
this article, we report on the use of XRD-CT to gain insight into the
microstructure of two fossil bones. We demonstrate for the first time
that both the spatial distribution of minerals and the 3D orientation of
HA can be obtained without damage to the fossils. Our XRD-CT approach
opens new opportunities for non-destructive extraction of
microstructural information from mineralized biological samples.
Samples were prepared from three bones: 1) The humerus of an extant tetrapod, Desmognathus quadramaculatus, for which the identification of a muscle insertion was known. The humerus was sectioned at the location of a muscle insertion2,7,
and raster-scanning XRD mapping was performed on a 50 µm thin section
to validate the concept of visualising changes of HA orientation at the
site of a muscle insertion in a fresh bone. 2) The tibia of a fossil
specimen, the 300-million-year-old Discosauriscus austriacus, where the location of a muscle insertion was known from observations using polarised light30. An XRD-CT measurement was made in the region of the muscle insertion (Fig. S1a),
confirming that the diagenesis did not destroy the crystal structure of
HA, which is crucial for our XRD-CT approach to work. 3) The humerus of
a 370-million-year-old lobe-finned fish Eusthenopteron foordi36,
which has remained un-sectioned but for which we know there are muscle
insertions based on local high-resolution images produced by
phase-contrast micro-CT7. The humerus of Eusthenopteron foordi has a complex shape and microanatomy37
which is representative of most fossil bones. To the best of our
knowledge, this is the first time 3D XRD-CT has been used for
non-destructive structural analysis on a complex-shaped fossil bone.
XRD-CT reconstruction procedure
To
understand the procedures we used for XRD-CT measurements and
reconstruction, it is instructive to first reconsider the fundamentals
of attenuation-CT, shown for parallel beam geometry in Fig. 1a. For a collimated monochromatic X-ray beam propagating in the z-direction, one can quantitatively describe the X-ray attenuation using Lambert-Beer’s law,
It(x,y,ω)=I0exp(−∫μ(x′(ω),y′,z′(ω))ds)
(1)
Here It(x, y, ω) is the transmitted beam intensity, I0 the incoming beam intensity, μ(x′, y′, z′) the spatially resolved linear attenuation coefficient38. x, y and z are coordinates in the laboratory system (Fig. 1a), while x′, y′ and z refer
to the internal sample coordinates. The sample coordinate system
rotates during tomography with the sample projection angle ω, keeping y′ = y. The integral is taken over the distance through the sample for a given ray. The transmitted intensity It(x, y, ω) of the X-ray beam through the sample is measured for a wide range of projection angles ω, ideally covering 180°. The notation emphasizes that for each tomographic projection angle ω, the intensity is measured as a function of position (x, y). To reconstruct μ(x′, y′, z′)
from the measured data, the fast and robust filtered back-projection
(FBP) algorithm, which is based on the inverse Radon transform, is often
used38.
Figure 1
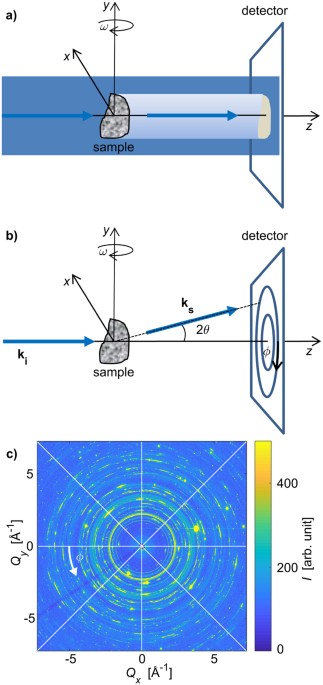
(a)
Sketch of a parallel-beam attenuation-based CT setup with a rotating
sample. A wide beam floods the sample, and the transmitted beam
intensity is recorded on a detector. Through tomographic reconstruction
the spatially resolved density of the sample is obtained. (b)
Sketch of a generic XRD-CT setup as employed in our experiment. The
collimated pencil beam from the synchrotron source with wavevector ki
enters the sample from the left. A fraction of the incoming beam is
elastically scattered by the sample, and exits on the right as a
scattered beam with wavevector ks, while the
remaining un-scattered photons exit the sample as a transmitted beam
which is blocked by a beam-stop. Diffraction patterns were measured for
different combinations of sample positions (x, y) and projection angles ω. (c) An example of a recorded diffraction pattern from the humerus of Eusthenopteron foordi
(with linear intensity scale). Continuous Debye-Scherrer diffraction
rings originating from HA can be seen, while the scattering from barite,
calcite, quartz and pyrite is seen as bright spots. The white lines
indicate sectioning of the diffraction patterns into azimuthal sections,
used for tomographic reconstruction. 8 sectors are indicated for
illustration purposes, while 64 sectors were used in the actual
analysis. The beam stop support is seen as a dark line in the lower left
region.
In XRD-CT, the measured diffracted
intensities, rather than the reduction in intensity (attenuation) of
the direct beam, are used to reconstruct the scattering characteristics
of each voxel in the sample volume (or cross-sectional area). Using
carefully designed criteria (cf. SI), we extracted information from each
2D diffraction pattern using what we coin descriptors Idescriptor (x, y, ω). These descriptors are designed to return one single scalar value for each combination of (x, y, ω),
which can then be fed into the FBP algorithm. Challenges arise because
the scattering signal from each voxel volume in the sample changes with
the projection angle. For retrieving the spatial distribution of
minerals we define the descriptor Ihklisotropic
as the integrated intensity over all ϕ (Figs. 1b,c and S2) for a given diffraction lattice plane family {hkl} (i.e. a given scattering vector length Q).
For the minerals being present in the bone samples with only few and
large crystallites, resulting in tomograms with streak artefacts when
reconstructing with the FBP algorithm, it proved useful to add several
Bragg peaks for the composition analysis. Conversely, because the HA
crystallites turned out to be small, numerous, and with wide orientation
distributions, the descriptor for determining the spatial distribution
of HA could be based on any of the HA Bragg peaks. The 002HA
reflection was selected for texture analysis because it has an easy
interpretation as the unique axis of the hexagonal unit cell. We further
define the descriptor Itotal as the integrated intensity over all ϕ and Q, which is sensitive to the presence of any scattering compound in the sample.
The
directional information contained in a diffraction pattern can be used
to infer the orientation of the scattering mineral crystals. Two
descriptors were designed to estimate the HA crystallite orientation,
based on measurements with one or three tomography axes (Fig. S1). The single-axis approach was to first reconstruct the location of the HA crystallites based on the meridional I|| and equatorial I⊥
scattered intensities separately (cf. SI). Each descriptor yields its
separate tomogram, showing the corresponding relative scattering of the
HA. Because the HA was only weakly anisotropic, these tomograms were at
first glance similar, but numerical comparisons indicated regions with a
difference in the vertical and horizontal scattered signal. It proved
useful to define an orientational parameter κ by
κ=I||−I⊥I||+I⊥
(2)
to quantify orientation
information. The other, multiple-axis, method of determining the HA
crystallite orientation was to do several (here: three) full tomography
scans with the sample mounted in different orientations with respect to
the tomographic rotation axis. I|| from a given
location (voxel) in the sample will remain essentially invariant during
sample rotation, which is a requirement for tomographic reconstructions
using FBP. Having measured the sample with three orthogonal
orientations, giving three different tomograms each based on I||, gives the possibility of estimating an approximate vectorial tomogram, with one dominant HA crystallite orientation assigned to each of the voxels. For a more detailed explanation, cf. SI.
Results
Results for the extant reference and the two fossil samples are presented. Both fossil samples, the tibia from Discosauriscus austriacus and the humerus from Eusthenopteron foordi,
contained minerals of different crystallite sizes. The HA crystallites
were small (compared to the reconstructed voxel size) and numerous, with
many crystallites satisfying the diffraction condition simultaneously,
regardless of sample position and orientation. The other minerals,
secondarily present in the bone due to the fossilisation, had larger
crystallites, giving rise to bright spots in the diffraction patterns
(Fig. 1c).
Consequently, we could derive composition maps for all minerals, while
for HA, also orientational maps indicating the dominant orientation
could be obtained.
Scanning XRD of an extant salamander bone slice showing oriented HA crystallites
A 50 µm thin section made at midshaft in the humerus of the extant salamander Desmognathus quadramaculatus
was studied to serve as a benchmark for the subsequent studies of
fossil samples, demonstrating that the presence and orientation of HA in
the vicinity of muscle attachments can be identified using XRD.
Comparing Fig. 2a,b, it is apparent that polarised microscopy8
reveals a change of the collagen structure at the muscle attachments.
The raster-scanning XRD measurement of the physically cut thin slice
shown in Fig. 2e
demonstrates that the orientation of the HA associated to the collagen
fibres is indeed markedly different at the muscle attachment. Precisely,
observing this structural modification in the diffracted signal
suggests that XRD-CT can be used to study muscle attachments also in
fossilised samples, which is the prime motivation for this study.
Figure 2f
shows the size and radial orientation of extrinsic fibres at the
location of a muscle attachment, as studied with phase-contrast CT. It
is important to note that even though phase contrast CT measurements
resolve the bone structure to high detail, these images do not contain
information about the HA orientation.
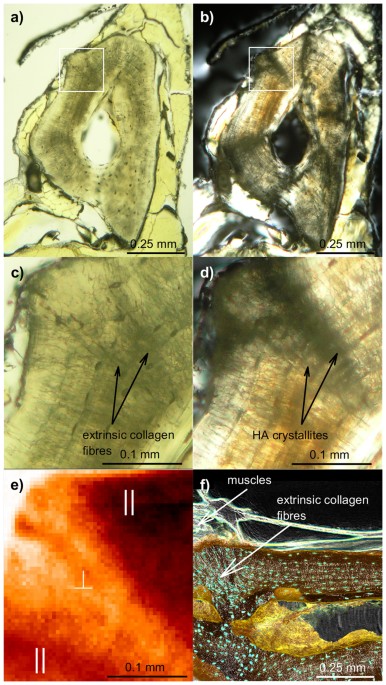
Figure 2
Humerus of the extant salamander Desmognathus quadramaculatus. (a,b)
Natural and polarised light micrographs of a physically cut cross
section through the sample, respectively, showing the region where the
raster-scanning XRD map in (e) was made. (c,d) Details of the regions in (a) and (b), respectively. The arrows in (c) and (d) indicate locations of extrinsic collagen fibres and HA crystallites associated with muscle attachments. (e) Raster-scanning XRD map of the area indicated with a white rectangle in (a,b) and zoomed in (c,d), demonstrating that there is texture of the 002HA
reflection which can be mapped by XRD. Regions with either dominating
meridional (out-of plane) diffraction or equatorial (in-plane)
diffraction are marked by ∥ or ⊥
, respectively. In other words, brighter hues of red correspond to the HA c-axis being more inclined with respect to the long-axis of the bone. (f)
Longitudinal phase-contrast CT section, clearly showing the presence of
extrinsic fibres at the location where muscles attach to the bone
surface (indicated by an arrow).
2D XRD-CT of the tibia of Discosauriscus austriacus showing oriented HA crystallites
The tibia of Discosauriscus austriacus (Fig. 3a)
was chosen as a first fossil sample for observing muscle attachments
because it has a simple long-bone shape. This gives a uniaxial
distribution of the HA crystallites with the c-axis tending to be
parallel to the long axis, except in the vicinity of muscle
attachments. XRD-CT and images of thin sections, taken with polarized
light, were compared on this fossil bone to check whether the diagenesis
modifies the crystal structure of HA, which would alter the diffraction
signal. A thin section was made at midshaft39 (Fig. 3a) where a muscle insertion could be visualised using polarised light (Fig. 3b).
A 2D XRD-CT measurement (a single cross section) was obtained on the
remaining half of the tibia embedded in polyester resin (Fig. S1). Bragg peaks corresponding to HA, as well as a broad scattering feature in Q corresponding to the surrounding amorphous resin, were indexed and used for tomographic reconstructions (Fig. 3c–f).
HA in the bone and resin around the bone are distinctly visualized,
illustrating how XRD-CT allows accurately mapping out regions containing
different compounds.
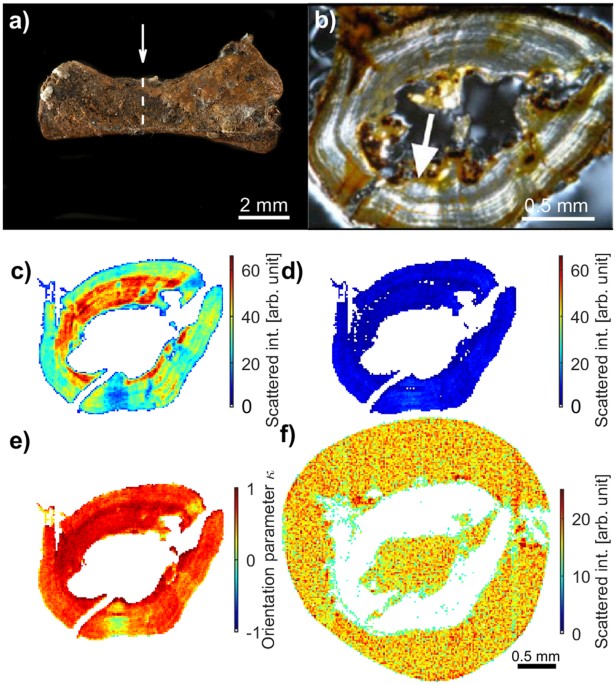
Figure 3
Tibia of the fossil tetrapod Discosauriscus austriacus (DE KO 58). (a)
Photograph of the sample studied before sectioning. The arrow indicates
the location of the cross-section measured with polarised light and
XRD-CT. The photograph is provided by P. Loubry. (b) Polarised light micrograph of the physically-cut tibia cross section shown in (a).
The arrow indicates the position of one of the muscle attachments,
which corresponds to the region of maximum orientation contrast in the
XRD-CT data, cf. (e). (c–f) Vectorial XRD-CT tomograms of the cross section in (a). (c) Tomograms based on I002HA||
and (d) I002HA⊥ (e) Normalized difference of the tomograms in (a) and (b), by using the orientation parameter κ (Equation 2). (f) Tomogram based on Iresinisotropic
The gross orientation of the HA crystallites in the tibia diaphysis of Discosauriscus austriacus was obtained by comparing tomograms reconstructed separately from the meridional (vertical) descriptor I|| and the equatorial (horizontal) descriptor I⊥. Note that albeit I⊥ does not fulfil the Bragg condition for all sample rotations (as the meridional descriptor I|| does), the horizontal scattering still clearly provided visible image features (Fig. 3d).
As seen, the vertical scattering is more intense than the horizontal
scattering, due to the preferred orientation of the HA crystallites. A
map of the orientation parameter κ (Equation 2) indicates that the position of muscle insertions in the bone sample coincides with the region of minimum difference in I⊥ and I|| (Fig. 3e), as supported by a physically cut slice of the sample made in the same region viewed under polarised light (Fig. 3b).
3D XRD-CT of the humerus of Eusthenopteron foordi showing the location of minerals
For the humerus of Eusthenopteron foordi,
we performed three full XRD-CT measurements by laterally
raster-scanning the whole sample for a large number of projection angles
(cf. Methods). Bragg peaks corresponding to HA, barite, calcite, quartz
and pyrite were indexed. Figure 4 shows a 3D mapping of the spatial mineral distribution in the humerus of Eusthenopteron foordi. Reconstructed tomograms based on Iisotropic
for HA, barite, calcite and quartz are visualized separately, all with a
surrounding semi-transparent region corresponding to a tomogram based
on Itotal. The pyrite signal was too weak to give
reliable tomograms. Note how the spatial distributions of the various
minerals are complementary to each other, jointly filling the 3D region
constituting the sample.
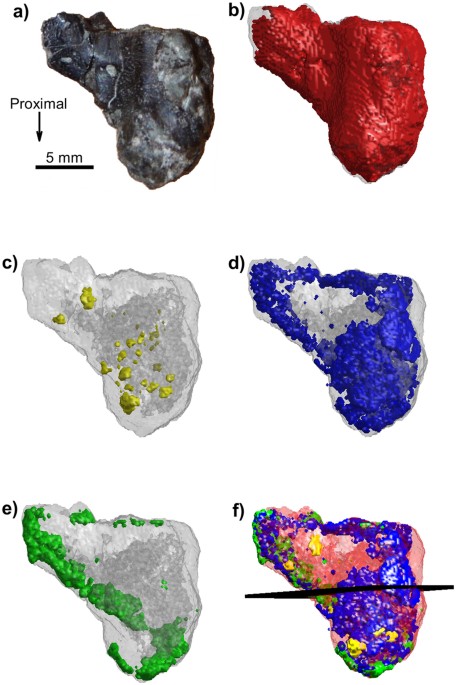
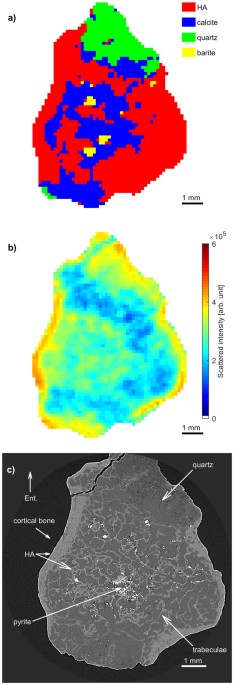
Figure 4
Humerus of the fossil lobe-finned fish Eusthenopteron foordi (NRM P246c) in mesial view. (a) Photograph of the sample studied. (b–f) 3D compositional tomograms of different minerals. (b) HA (red), (c) barite (yellow), (d) calcite (blue), (e) quartz (green). The grey shaded region in (b–e) corresponds to the total scattered signal Itotal
(integrated over the whole detector). Notice how the HA volume overlaps
almost completely with the volume reconstructed by the total scattered
signal. (f) Combined tomograms of all materials in (b–e),
using the same colour coding, with HA semi-transparent for increased
visibility. The plane plotted in the middle of the sample gives the
location of the cross section shown in Fig. 5.
A cross-section of the reconstructed compositional XRD-CT tomograms (Fig. 4f) is shown in Fig. 5a. The total scattered signal Itotal is shown in Fig. 5b. A phase-contrast tomogram is shown in Fig. 5c
for comparison. Regions containing different minerals have been
labelled, and albeit having much higher resolution, the locations of the
different minerals in the sample are qualitatively consistent with what
is found through the XRD-CT analysis. The HA crystallites are located
in the cortical and cancellous bone, while the quartz covers large
regions inside the rock matrix, in-between bony trabeculae. There are
also small regions of barite (Fig. 4c),
matching what is seen in the XRD-CT tomograms. The determination of the
locations of pyrite could not be ascertained in the XRD-CT
measurements, due to diffraction peak overlap.
Figure 5
2D cross sections of Eusthenopteron foordi (NRM P246c) CT measurements, midshaft of the humerus, corresponding to the plane indicated in Fig. 4f. (a) XRD-CT cross section showing the dominating mineral present at each voxel. (b) XRD-CT cross section based on Itotal, being a rough estimate of the density of scattering material. (c)
Phase contrast tomographic cross-section. Regions containing HA
(cortical and trabecular bone), barite, quartz and pyrite have been
labelled. Abbreviation: Ent., entepicondyle.
3D orientation of HA in the humerus of Eusthenopteron foordi revealed by vectorial XRD-CT
With three XRD-CT datasets obtained at orthogonal orientations (axes labelled y1, y2, and y3 in Fig. 6) for the humerus of Eusthenopteron foordi, the spatially resolved preferred orientation of HA could be estimated. The meridional descriptor I002HA||
for selecting intensity was applied to the 002HA
diffraction peak, giving for each of the three datasets an independent
vectorial 3D tomogram emphasizing the regions having the highest density
of HA crystallites oriented with the unit cell c-axis predominantly parallel to the actual tomographic axis. These tomograms are presented in Figs. 6 and 7, demonstrating that the c-axis of the HA unit cell tends to follow the external surface of the fossil bone, corroborating earlier reports9.
As for the compositional tomograms, it gives credibility to the
reconstruction algorithm that the tomograms independently show
continuous regions that are complementary to each other.
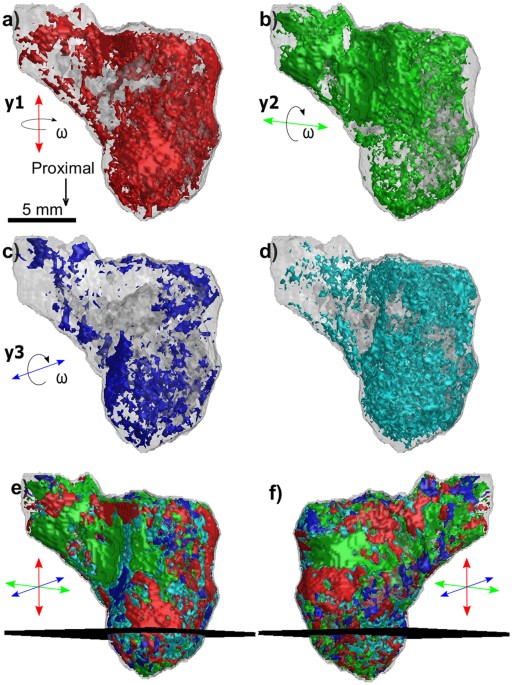
Figure 6
HA crystallite orientation in the bone of the humerus of Eusthenopteron foordi (NRM P246c) in mesial view. (a–c) Orientation-dependent 3D tomograms based on I||, indicating the locations of HA crystallites with the unit cell c-axis
predominantly parallel to the experimental tomographic axis (indicated
with an arrow for each case). To be judged significantly anisotropic,
the intensity contribution along one axis had to be at least 30% higher
than for the other two axes, otherwise the HA orientation in the voxel
was considered to be isotropic. The dominating direction of the HA
crystallite c-axis in different regions of the sample is
color-coded and indicated by the arrows. Red indicates a proximal
orientation of HA. Blue and green denote transverse orientations; blue
follows the entepicondyle axis of the humerus while green shows an
orientation orthogonal to the entepicondyle axis. (d) Tomogram highlighting voxels with isotropically oriented HA. (e,f)
Preferred orientation of HA, visualized by a superposition of the three
orthogonal tomograms, shown in two different views. The mesh plane at
the lower half of the bone marks the position of the 2D section shown in
Fig. 7.
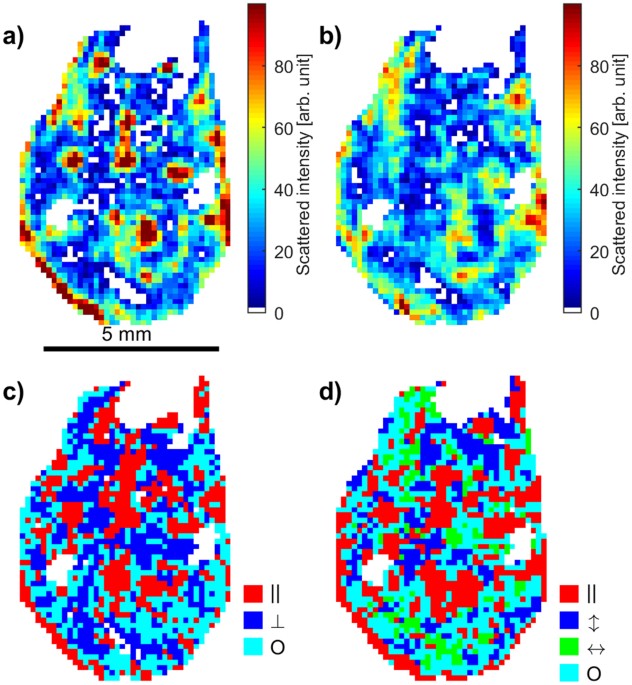
Cross section from 3D vectorial XRD-CT of the humerus of Eusthenopteron foordi (NRM P246c) yielding orientation information about the HA crystallites. (a) Single-axis tomogram based on I002HA||
, (b) single-axis tomogram based on I002HA⊥, (c) single-axis orientation parameter κ (Equation 2).
Red colour corresponds to dominating out-of-plane scattering, while
blue (small regions) indicate dominating in-plane scattering. Cyan means
that the in-plane and out-of-plane contributions are approximately
equal. (d) Orientation information reconstructed from the multiple-axis tomogram using I002HA|| from each data set. This 2D section is a slice through the tomogram indicated by a plane in Fig. 6e,f.
Results from both methods show consistency, and as expected, more
details are visible in the multi-axis approach. Some empty regions in
the sample (white) appear in all tomograms due to presence of other
minerals than HA or low diffracted intensities I002HA|| or I002HA⊥
A closer investigation of a 2D section of the humerus of Eusthenopteron foordi is given in Fig. 7,
comparing orientation maps obtained using the single-axis XRD-CT method
(with the tomographic axis perpendicular to the section, i.e. proximal)
to the multiple-axis (three) orthogonal XRD-CT scans. The corresponding
section is marked by a plane in Fig. 6e,f. Figure 7d shows the bone reconstructed from three datasets using I|| for the 002HA reflection, i.e. a 2D version of the 3D figures in Fig. 6. As can be seen in Fig. 7d,
the dominating HA orientation varies in the surrounding cortical bone,
thereby reflecting both the orientation of the HA in the bone matrix and
the HA associated to the extrinsic fibres of the muscle insertions. HA
in the spongiosa in the middle of the 2D section seems to have a
preferred orientation along the bone axis (proximal). For generating the
orientation map in Fig. 7c, we used the orientation parameter κ (Equation 2),
with the additional requirement that the intensity along one direction
should be at least 30% higher in one direction than the others, or
otherwise the scattering was considered isotropic. The results from the
single- and multiple-axes approaches are seen to be consistent, with the
latter approach of course giving additional in-plane information. A
comparison of Fig. 7c,d exhibits a gratifying similarity of the regions consisting of HA crystallites oriented with the c-axis
out of the 2D section plane. One limitation of using a single
tomographic dataset is a reduced ability at distinguishing between
dominating horizontal scattering, i.e. crystallite orientation in the 2D
section plane, and isotropic scattering.
Discussion
XRD-CT
allows retrieving spatially resolved mineral identification and
orientation information of semi-crystalline regions from non-destructive
diffraction experiments. The diffraction contrast underlying XRD-CT
thus provides information that cannot be obtained from conventional
tomography. For the first time this method was applied, with success, to
fossil hard tissues.
Using polarised light microscopy and
scanning-XRD we demonstrated on a known muscle insertion in a physically
cut thin slice of cortical bone from an extant salamander (Fig. 2)
that the orientation of HA at muscle insertions could be mapped. We
further showed that XRD-CT with a voxel size of 20 μm can be applied to
fossil bones to map their muscle insertions. Indeed, a muscle insertion,
previously identified using polarised light, could be observed in the
tibia diaphysis of Discosauriscus austriacus by XRD-CT (Fig. 3). Significant equatorial scattering (I⊥)
was observed, and tomograms of the diffracted signal showed explicitly
that this scattering originated from regions that coincided with a
muscle attachment. In other words, XRD-CT with a single tomography axis
can therefore be able to locate the position of muscle attachments in
fossil bones.
As XRD-CT for muscle attachment mapping seemed
promising, we decided to apply this method to a long-bone of the 370
million-year-old lobe-finned fish Eusthenopteron foordi. The more complex microarchitecture of the humerus of Eusthenopteron foordi
was revealed by combining three independent full XRD-CT measurements
with orthogonal tomography rotation axes. Reconstructed tomograms based
on diffraction contrast, using the FBP algorithm for different scalar
“descriptors” (integrated intensities), demonstrated the identification
and location of different minerals to a voxel size of 150 μm. Due to the
comparably large size of the humerus of Eusthenopteron foordi,
the measurement in 3D had to be done with a lower resolution to keep the
measurement time manageable. Finding the locations of muscle
attachments unfortunately proved to be more complicated at this
resolution. Indeed, the orientation analysis revealed that the cortical
bone of the humerus seems to contain larger regions with dominating
scattering in either of the perpendicular directions. Smaller regions
corresponding to muscle attachments, previously identified with phase
contrast CT7, could not be observed conclusively in these XRD-CT 3D tomograms. Consistently with previous studies40, this implies that the preferred direction of the HA crystallite c-axis
varies rapidly as function of position, thus requiring higher
resolution and making the precise determination of muscle attachments
much more difficult in 3D.
Using exclusively the meridional part of the 002HA
Debye-Scherrer diffraction ring, we have demonstrated that spatially
resolved information on the preferred orientation of HA in both the
cortical and trabecular bone can be retrieved. In the cortical bone of
the humerus of Eusthenopteron foordi, the HA crystallites in the
diaphysis did not seem to exhibit a global preferential orientation.
Locally, the crystallites were either longitudinally oriented,
transversally oriented or organized with no preferential orientation.
This observation is certainly due to the non-tubular and more complex
shape of the Eusthenopteron foordi sample as compared to the long-bone of Discosauriscus austriacus, and would require a more sophisticated measurement scheme to be fully resolved.
The
analysis of fossil bone matrix ultrastructure allows interpretations on
the paleobiology of animals, including bone growth rates10,39 and/or adaptations to biomechanical loads41. Indeed, because the bone surface of the tibia of Discosauriscus austriacus was smooth and the bone long axis was oriented parallel to the tomography axis, the 002HA Bragg peak could mainly be observed in the meridional direction (I||), thereby revealing that the gross orientation of HA was essentially parallel to the tomography axis (Fig. 3), i.e. with the HA c-axis
parallel to the long axis of the bone. This confirms the identification
of a parallel-fibred bone interpreted as the result of a relatively
slow bone deposition rate39.
Of course, using multiple-axes full tomography measurements with the
sample in different orientations with respect to the tomography axis
would have enabled more precise evaluations of the spatially varying
main crystallite orientation16,29
at the cost of a more complex and time-consuming experiment, which was
not considered essential for the current purpose. We note that in
addition to the biological information, XRD-CT also revealed details of
the diagenesis. In the present study, we demonstrated that we could
localize regions of calcite, barite and quartz resulting from the
fossilisation.
Recently, other studies have been published16,29,31
on reconstructing 3D orientation from non-crystalline objects using
extensive data collection and advanced reconstruction algorithms, based
on a large number of tomographic axes giving huge datasets. However, in
our case the favourable nature of the HA crystallites allowed a simpler
data collection and reconstruction process, using only one or three
tomography axes. Combining scalar “descriptors” with the commonly used
FBP algorithm is intuitively simple and easy to implement. It
facilitates the analysis if the crystallites of interest have a close to
isotropic distribution, and if their size is small compared to the beam
size (or equivalently, small compared to the reconstructed voxel size).
As explained in detail, the minerals constituting the Eusthenopteron foordi
sample were found to exhibit different orientation properties and
crystallite sizes. Importantly, the HA crystallites were deduced to be
small compared to the voxels measured, because their orientation
distributions were smooth, even when diffraction patterns from small
volumes near the sample edge were studied. The HA crystallites exhibited
broad orientation distributions (Δϕ > 50°, cf. SI), and the
direction of the preferred orientation relative to the tomography axes
was found to vary smoothly and systematically throughout the sample. For
our approach based on the FBP, the spatially slowly varying HA
orientation was decisive for being able to carry out the vectorial
tomographic reconstructions for this material. Two procedures for
creating vectorial tomograms were considered, one method using three
orthogonal tomographic axes, the other using a single axis. The
equatorial scattering I⊥,
being perpendicular to the sample rotation axis, varied strongly during
sample rotation, and FBP reconstruction artefacts in the tomograms must
be expected for this reason. Nevertheless, as demonstrated, convincing
similarities were found between the vectorial tomograms reconstructed
from single-axis and three-orthogonal-axes tomographic measurements.
Future work could consider the possibility of adopting iterative
tomography reconstruction methods, effectively fitting an entire
computer-generated 3D model, including spatial orientation
distributions, to fully exploit the information contained in the
experimental diffraction patterns.
In the special case of the
sample containing a high number of small weakly textured oriented
crystallites, XRD-CT provides detailed composition tomograms down to the
limiting parameters of this experiment, i.e. the beam diameter giving
reconstruction voxels of size 150 μm. The detector pixel size of
400 μm × 400 μm caused a resolution in Q of about 0.015 Å−1. For the type of analysis performed, this rather low resolution in Q
was an issue, as there were several overlapping Bragg peaks from the
minerals. Of course, a higher detector resolution would demand even more
from the data handling systems both during and after the experiment. A
higher detector resolution would also allow extracting information about
the crystallite size from the width of the Bragg peaks. Despite
these limitations in this pioneering study, we have demonstrated for the
first time that the spatially varying preferred orientation of HA in
fossils can be obtained non-destructively.
The net exposure time for the XRD-CT experiments was approximately one hour for the tibia of Discosauriscus austriacus and approximately 24 hours for the humerus of Eusthenopteron foordi.
There were additionally other time-consuming steps, e.g. calibration of
the setup, alignment of samples before the start of each measurement
and recording of dark current frames from the detector during the
measurements. The total time spent on the experiments was therefore
approximately 12 hours for the tibia of Discosauriscus austriacus and approximately 72 hours for the humerus of Eusthenopteron foordi.
While the measurement strategy employed for these experiments was time
consuming, we consider it likely that with the development of new
high-brilliance synchrotron sources, more efficient detectors and
read-out methods, XRD-CT in the near future can be performed at least
one order of magnitude faster.
The current study demonstrates that
XRD-CT is on the verge of becoming a powerful method for mapping in 3D
the mineral composition and orientation in fossil samples. We showed
here, to the best of our knowledge for the first time, that the
information of muscle insertions could be retrieved with certainty in
extant and fossil tetrapod bones. The muscle attachments are of vital
importance to deduce how the extinct animals were moving through
advanced biomechanical analysis. For the established method of polarized
microscopy, it certainly is a huge disadvantage that scarce fossils
have to be destroyed to extract the desired data. While the resolution
in this study was too low to resolve the muscle attachments in the
humerus of Eusthenopteron foordi in 3D, this pilot study still
demonstrates the feasibility of extracting such information, even for
old fossil bones. This is a considerable contribution towards the
development of diffraction-based CT techniques for reconstructing the
rearrangement of soft tissues through major evolutionary events. Despite
the efforts that are needed to carry out an XRD-CT experiment and its
subsequent analysis, we believe that the unique information that can be
extracted from such experiments will prove the technique crucial for
studying palaeontological, biological and synthetic functional materials
in future.
Methods
The specimen of Desmognathus quadramaculatus was collected under ethical guidelines for research study by Bruce et al.42.
The humerus was dissected, dried and embedded in a polyester resin. The
bone was sectioned using an annular diamond-powder saw. The
observations were made under polarized light through a Zeiss Axiovert 35
optical microscope. Pictures were taken with an Olympus Camedia C5060
camera fixed on the microscope at Sorbonne University (UPMC, France).
The acid-prepared43. specimen of Discosauriscus austriacus
(DE KO 58) is stored in the research collections of the Comenius
University (Bratislava, Slovakia). The limb bone was embedded in a
polyester resin to be sectioned, using the same method as for Desmognathus quadramaculatus. The mechanically prepared specimen of Eusthenopteron foordi (NRM P246c) was provided by Naturhistoriska Riksmuseet (Stockholm, Sweden).
All
XRD-CT measurements on the two fossil samples were performed at
beamline ID15A at ESRF, using a monochromatic beam with a wavelength
0.143 Å (86.6 keV). 2D diffraction patterns were recorded on a
Perkin-Elmer XRD 1621 N ES Series detector with an effective pixel size
of 400 μm × 400 μm. The exposure time for each recorded diffraction
pattern was 70 ms for the tibia of Discosauriscus austriacus and 35 ms for the humerus of Eusthenopteron foordi. One highly resolved tomographic cross section was measured in the tibia of Discosauriscus austriacus,
transversally through the diaphysis of the sample, resulting in a
reconstructed pixel size of approximately 20 μm × 20 μm. For the humerus
of Eusthenopteron foordi, the entire sample volume was imaged
with three independent full sets of XRD-CT measurements. The latter were
performed with three approximately orthogonal orientations of the
sample on the sample stage, allowing information about the preferred
orientation to be extracted. For each tomographic projection angle ω, 100 steps in x and y
and 80 rotation angles were used, resulting in an effective voxel size
of approximately 150 μm × 150 μm × 150 μm. For further details about the
XRD-CT measurements and reconstruction procedure, cf. SI.
Transmission
raster-scanning XRD measurements were performed at beamline ID27 at
ESRF. An orientation map was obtained in the vicinity of a muscle
insertion in a thin physically cut section of the humerus of the
(extant) salamander Desmognathus quadramaculatus. For these
measurements, a beam with wavelength 0.374 Å (33.2 keV) and a 20 × 20 µm
cross section was used. Diffraction patterns were collected on a MAR345
image-plate detector with 158 × 158 µm pixel size and integrated using
the XRDUA software44. The complete 2D data set consists of 61 × 51 diffraction patterns.
Additional information
Publisher's note: Springer Nature remains neutral with regard to jurisdictional claims in published maps and institutional affiliations.
References
1.
Cunningham, J. A., Rahman, I. A., Lautenschlager, S., Rayfield, E. J. & Donoghue, P. C. J. A virtual world of paleontology. Trends Ecol Evol29, 347–357 (2014).
Sanchez,
S., Ahlberg, P. E., Trinajstic, K. M., Mirone, A. & Tafforeau, P.
Three-dimensional synchrotron virtual paleohistology: a new insight into
the world of fossil bone microstructures. Microsc Microanal18, 1095–1105 (2012).
Benjamin, M. et al. The skeletal attachment of tendons—tendon ‘entheses’. Comparative Biochemistry and Physiology Part A: Molecular & Integrative Physiology133, 931–945 (2002).
Benjamin, M. et al. Where tendons and ligaments meet bone: attachment sites (‘entheses’) in relation to exercise and/or mechanical load. Journal of anatomy208, 471–490 (2006).
Sanchez, S. et al.
3D microstructural architecture of muscle attachments in extant and
fossil vertebrates revealed by synchrotron microtomography. PLoS One8, e56992 (2013).
Bromage, T. G. et al. Circularly polarized light standards for investigations of collagen fiber orientation in bone. The Anatomical Record274, 157–168 (2003).
Bacon,
G. E., Bacon, P. J. & Griffiths, R. K. Orientation of apatite
crystals in relation to muscle attachment in the mandible. J Biomech13, 725–729 (1980).
Francillon-Vieillot, H. B. V. et al. Microstructure and mineralization of vertebrate skeletal tissues. Skeletal Biomineralization: Patterns, Processes and Evolutionary Trends20, 471–1529 (1990).
Dumont, M., Pyzalla, A., Kostka, A. & Borbély, A. In Biology of the sauropod dinosaurs: Understanding the life of giants 150–170 (Indiana University Press, 2011).
12.
Zocco,
T. G. & Schwartz, H. L. Microstructural analysis of bone of the
sauropod dinosaur Seismosaurus by transmission electron microscopy. Palaeontology37, 493–504 (1994).
Dumont,
M., Borbely, A., Kaysser-Pyzalla, A. & Sander, P. M. Long bone
cortices in a growth series of Apatosaurus sp.(Dinosauria:
Diplodocidae): geometry, body mass, and crystallite orientation of giant
animals. Biological journal of the Linnean Society112, 782–798 (2014).
Klembara,
J. & Bartík, I. The postcranial skeleton of Discosauriscus Kuhn, a
seymouriamorph tetrapod from the Lower Permian of the Boskovice Furrow
(Czech Republic). Earth and Environmental Science Transactions of The Royal Society of Edinburgh90, 287–316 (1999).
Molnar,
J. L., Diogo, R., Hutchinson, J. R. & Pierce, S. E. Reconstructing
pectoral appendicular muscle anatomy in fossil fish and tetrapods over
the fins‐to‐limbs transition. Biol Rev93, 1077–1107 (2018).
Als-Nielsen, J. & MacMorrow, D. Elements of modern X-ray physics. 187–191 (Wiley, 2011).
18.
Brandon, D. G. & Kaplan, W. D. Microstructural characterization of materials. 261–331 (Wiley, 1999).
19.
Dumont,
M., Kostka, A., Sander, P. M., Borbely, A. & Kaysser-Pyzalla, A.
Size and size distribution of apatite crystals in sauropod fossil bones.
Palaeogeography, Palaeoclimatology, Palaeoecology310, 108–116 (2011).
Jörg, S. et al.
Two-dimensional X-ray diffraction as a tool for the rapid,
nondestructive detection of low calcite quantities in aragonitic corals.
Geochemistry, Geophysics, Geosystems16, 3778–3788 (2015).
Schroer, C. et al. Mapping the local nanostructure inside a specimen by tomographic small-angle x-ray scattering. Applied physics letters88, 164102 (2006).
Skjønsfjell, E. T. B. et al. High-resolution coherent x-ray diffraction imaging of metal-coated polymer microspheres. Journal of the Optical Society of America A35, (2017).
24.
Miao,
J. W., Charalambous, P., Kirz, J. & Sayre, D. Extending the
methodology of X-ray crystallography to allow imaging of
micrometre-sized non-crystalline specimens. Nature400, 342–344 (1999).
Alvarez-Murga, M. et al.
Microstructural mapping of C60 phase transformation into disordered
graphite at high pressure, using X-ray diffraction microtomography. J Appl Crystallogr44, 163–171 (2011).
Sanchez,
S., Tafforeau, P. & Ahlberg, P. E. The humerus of Eusthenopteron: a
puzzling organization presaging the establishment of tetrapod limb bone
marrow. P Roy Soc B-Biol Sci281 (2014).
38.
Kak, A. C. & Slaney, M. Principles of computerized tomographic imaging. 49–117 (IEEE Pr., 1988).
39.
Sanchez,
S., Klembara, J., Castanet, J. & Steyer, J. S. Salamander-like
development in a seymouriamorph revealed by palaeohistology. Biol Lett4, 411–414 (2008).
Nakano,
T., Ishimoto, T., Jee-Wook, L. & Umakoshi, Y. Preferential
orientation of biological apatite crystallite in original, regenerated
and diseased cortical bones. Journal of the Ceramic Society of Japan116, 313–315 (2008).
De
Margerie, E., Sanchez, S., Cubo, J. & Castanet, J. Torsional
resistance as a principal component of the structural design of long
bones: comparative multivariate evidence in birds. The Anatomical Record282, 49–66 (2005).
Bruce,
R. C., Castanet, J. & Francillon-Vieillot, H. Skeletochronological
analysis of variation in age structure, body size, and life history in
three species of desmognathine salamanders. Herpetologica58, 181–193 (2002).
Štamberg, S. Chemical preparation of vertebrates from the Lower Permian of the BoskoviceFurrow Acta Musei reginaehradecensis. Series A, Scientiae naturales29, 143–150 (2003).
De
Nolf, W., Vanmeert, F. & Janssens, K. XRDUA: crystalline phase
distribution maps by two-dimensional scanning and tomographic (micro)
X-ray powder diffraction. J Appl Crystallogr47, 1107–1117 (2014).
We
are grateful to Jozef Klembara from the Comenius University
(Bratislava, Slovakia) and Thomas Mörs at Naturhistoriska Riksmuseet
(Stockholm, Sweden) for providing the fossil material for the current
study. We thank Paul Tafforeau (ESRF) for his help during the experiment
at beamline ID19. We thank Irene Zanette (TUM) and Mario Scheel (ESRF)
for their help with the experiment at beamline ID15A. We acknowledge
Timothy Bromage (NYU), Armand de Ricqlès (MNHN) and Maïtena Dumont (UU)
for fruitful discussions. We thank Philippe Loubry (MNHN) for the
photograph of the tibia of Discosauriscus austriacus. Beamtime
was allocated at the European Synchrotron Radiation Facility for the
XRD-CT measurements at beamline ID15A (EC-1017); inhouse beamtime at
ID27 and phase contrast experiments at ID19 ID19 (ES-203). S.S. was
funded by a grant from the Vetenskapsrådet (2015-04335) and received a
stipend from Helge Ax:son Johnsons Stiftelse. F. K. M. and D.W.B.
gratefully acknowledge the Norwegian Research Council for financial
funding.
Author information
Author notes
Martin Bech and Dag W. Breiby contributed equally to this work.
Affiliations
Department of Physics, Norwegian University of Science and Technology, Høgskoleringen 5, 7491, Trondheim, Norway
Fredrik K. Mürer
& Dag W. Breiby
Science
for Life Laboratory and Uppsala University, Department of Organismal
Biology, Evolutionary Biology Centre, Norbyvägen 18 A, 75236, Uppsala,
Sweden
Sophie Sanchez
ESRF – The European Synchrotron, 71 Avenue des Martyrs, 38000, Grenoble, France
Sophie Sanchez
, Michelle Álvarez-Murga
& Marco Di Michiel
Sorbonne Université – CR2P – MNHN, CNRS, UPMC, 57 rue Cuvier, CP38, F-75005, Paris, France
Sophie Sanchez
Lehrstuhl
für Biomedizinische Physik, Physik-Department & Institut für
Medizintechnik, Technische Universität München, 85748, Garching, Germany
Franz Pfeiffer
Department
of Diagnostic and Interventional Radiology, Klinikum rechts der Isar,
Technical University of Munich, 81675, München, Germany
Franz Pfeiffer
Department of Medical Radiation Physics, Clinical Sciences, Lund University, 22185, Lund, Sweden
Martin Bech
Department of Microsystems, University of South-Eastern Norway, 3184, Borre, Norway
Dag W. Breiby
Contributions
F.P.,
S.S., M.B., M.M. and M.A. designed the experiment. S.S. prepared the
samples. F.P., S.S., M.B., M.M., M.A. and F.K.M. performed the
measurements. F.K.M., M.B. and D.W.B. analysed the data from the fossil
samples. M.A. performed the data analysis on the extant sample. S.S.
made biological and palaeontological interpretations. F.K.M. and D.W.B.
wrote the manuscript. All authors commented on the manuscript.
Nenhum comentário:
Postar um comentário
Observação: somente um membro deste blog pode postar um comentário.