Vertebrates
have greatly elaborated the basic chordate body plan and evolved highly
distinctive genomes that have been sculpted by two whole-genome
duplications. Here we sequence the genome of the Mediterranean amphioxus
(Branchiostoma lanceolatum) and characterize DNA methylation,
chromatin accessibility, histone modifications and transcriptomes across
multiple developmental stages and adult tissues to investigate the
evolution of the regulation of the chordate genome. Comparisons with
vertebrates identify an intermediate stage in the evolution of
differentially methylated enhancers, and a high conservation of gene
expression and its cis-regulatory logic between amphioxus and
vertebrates that occurs maximally at an earlier mid-embryonic phylotypic
period. We analyse regulatory evolution after whole-genome
duplications, and find that—in vertebrates—over 80% of broadly expressed
gene families with multiple paralogues derived from whole-genome
duplications have members that restricted their ancestral expression,
and underwent specialization rather than subfunctionalization.
Counter-intuitively, paralogues that restricted their expression
increased the complexity of their regulatory landscapes. These data pave
the way for a better understanding of the regulatory principles that
underlie key vertebrate innovations.
Main
All vertebrates share multiple morphological and genomic novelties1.
The most prominent genomic difference between vertebrates and
non-vertebrate chordates is the reshaping of the gene complement that
followed the two rounds of whole genome duplication (WGD)—the 2R
hypothesis—that occurred at the base of the vertebrate lineage2,3.
These large-scale mutational events are hypothesized to have
facilitated the evolution of vertebrate morphological innovations, at
least in part through the preferential retention of ‘developmental’ gene
families and transcription factors after duplication3,4.
However, duplicate genes and their associated regulatory elements were
initially identical and could not drive innovation without regulatory
and/or protein-coding changes.
To date, the effect of vertebrate
WGDs on gene regulation have remained poorly understood—both in terms of
the fates of duplicate genes and the acquisition of the unique genomic
traits that are characteristic of vertebrates. These traits include
numerous features that are often associated with gene regulation, such
as unusually large intergenic and intronic regions5,6, high global 5-methylcytosine (5mC) content and 5mC-dependent regulation of embryonic transcriptional enhancers7.
To investigate these traits, appropriate species must be used for
comparisons. Previous studies have largely focused on phylogenetic
distances that are either too short (such as human versus mouse) or too
long (such as human versus fly or nematode), resulting in limited
insights. In the first case, comparisons among closely related species
(for example, between mammals8,9,10,11)—for
which the orthology of non-coding regions can be readily determined
from genomic alignments—have allowed fine-grained analyses of the
evolution of transcription-factor binding. In the second case, three-way
comparisons of human, fly and nematode by the modENCODE consortium
revealed no detectable conservation at the cis-regulatory level12 and very little conservation of gene expression13. Moreover, the genomes of flies and nematodes are highly derived14,15,16.
Thus, we lack comprehensive functional genomic data from a
slow-evolving, closely related outgroup that would enable an in-depth
investigation of the origins of the vertebrate regulatory genome and of
the effect of WGDs on gene regulation.
Unlike flies, nematodes and
most non-vertebrates, amphioxus belongs to the chordate phylum.
Therefore, although amphioxus lacks the specializations and innovations
of vertebrates, it shares with them a basic body plan and has multiple
organs and structures homologous to those of vertebrates1.
For these reasons, amphioxus has widely been used as a reference
outgroup to infer ancestral versus novel features during vertebrate
evolution. Here, we undertook a comprehensive study of the transcriptome
and regulatory genome of amphioxus to investigate how the unique
functional genome architecture of vertebrates evolved.
Functional genome annotation of amphioxus
We generated an exhaustive resource of genomic, epigenomic and transcriptomic data for the Mediterranean amphioxus (B. lanceolatum), comprising a total of 52 sample types (Fig. 1a and Supplementary Data 2, datasets 1–5).
These datasets were mapped to a B. lanceolatum
genome that was sequenced and assembled de novo, with 150× coverage, a
total size of 495.4 Mbp, a scaffold N50 of 1.29 Mbp and 4% gaps
(Extended Data Fig. 1a–c). To facilitate access by the research community, we integrated these resources into a UCSC Genome Browser track hub (Fig. 1b; available at http://amphiencode.github.io/Data/),
together with an intra-cephalochordate sequence conservation track and a
comprehensive annotation of repetitive elements (Extended Data Fig. 1d–f) and long non-coding RNAs (Extended Data Fig. 1g and Supplementary Data 2,
dataset 6). To enable broader evolutionary comparisons, we
reconstructed orthologous gene families for multiple vertebrate and
non-vertebrate species (Supplementary Data 2, dataset 7), generated several equivalent datasets for zebrafish and medaka (Extended Data Fig. 2a), and built a dedicated server for synteny comparisons (Extended Data Fig. 1h).
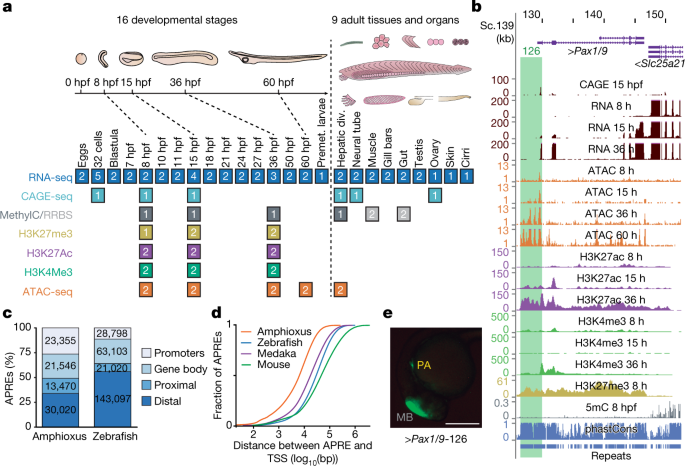
Fig. 1: Functional genome annotation of amphioxus.
a,
Summary of the 94 amphioxus samples generated in this study, comprising
eight functional-genomic datasets. The number of biological replicates
is indicated for each sample type. div., diverticulum; MethylC/RRBS,
methylC sequencing and reduced representation bisulfite sequencing;
Premet., premetamorphic. b, Genome browser excerpt showing a
selection of available tracks, including gene annotation, sequence
conservation (using phastCons), repeats and several epigenomic and
transcriptomic datasets. Green rectangle highlights the APRE tested in e. c,
Numbers and proportions of amphioxus and zebrafish APREs according to
their genomic location. Promoters, within 1-kbp upstream and 0.5-kbp
downstream of an annotated TSS; gene body, within an orthology-supported
gene; proximal, within 5-kbp upstream of (but not overlapping with) a
TSS; distal, not in the aforementioned categories. d, Cumulative distributions of the distance between each APRE and the closest annotated TSS in each species. e,
Lateral view of a representative transgenic zebrafish 26-hpf embryo
showing GFP expression driven by an amphioxus APRE associated with Pax1/9 (‘Pax1/9-126’, highlighted in b) in pharyngeal arches (PA; n = 4/4). Positive-control enhancer was expressed in the midbrain (MB). Scale bar, 250 μm.
A comprehensive functional annotation of the B. lanceolatum genome identified 88,391 putative cis-regulatory
elements of DNA as defined by assay for transposase-accessible
chromatin using sequencing (ATAC-seq) (these elements are hereafter
referred to as APREs), as well as 20,569 protein-coding genes supported
by orthology. We divided the APREs into promoters—around transcription
start sites (TSSs), which were highly supported by cap analysis
gene-expression sequencing (CAGE-seq) data, Extended Data Fig. 2b—and gene-body, proximal and distal APREs (Fig. 1c).
Equivalent analyses using zebrafish data yielded 256,018 potential
regulatory regions, with a significantly higher proportion of these
being distal APREs (Fig. 1c; P < 2.2 × 10⁻¹⁶,
one-sided Fisher’s exact test). A significantly larger global TSS
distance in APREs was observed for all vertebrates compared to amphioxus
(Fig. 1d), even after correcting for differences in average intergenic length among species (Extended Data Fig. 2c; P < 2.2 × 10⁻¹⁶
for all vertebrate-versus-amphioxus comparisons, one-sided Mann–Whitney
tests). Amphioxus APREs showed enrichment for enhancer-associated
chromatin marks (Extended Data Fig. 2d), which were highly dynamic during embryo development (Extended Data Fig. 2e-g), and consistently drove GFP expression in zebrafish or amphioxus transgenic assays (93% (14/15), Fig. 1e and Extended Data Fig. 2h, i).
Moreover, 89% (32/36) of previously reported amphioxus enhancers
overlapped APREs defined by our data. Therefore, a large fraction of
APREs probably act as developmentally regulated transcriptional
enhancers.
Disentangling vertebrate bidirectional promoters
Analyses
of core promoters, defined by CAGE-seq, at single-nucleotide resolution
revealed that amphioxus promoters display a mixture of pan-metazoan,
pan-vertebrate and unique features (Extended Data Fig. 3 and Supplementary Information).
These analyses also identified that 25% (3,950/15,884) of neighbouring
protein-coding genes were arranged in bidirectional promoters.
Bidirectional promoters were most common among ubiquitous promoters
(Extended Data Fig. 4a), displayed a marked periodicity in the distance between promoters (Extended Data Fig. 4b, c) and were associated with genes that were significantly enriched in housekeeping functions (Extended Data Fig. 4d).
Notably, the fraction of bidirectional promoters defined by CAGE-seq
decreased progressively from amphioxus to mouse (12.83% (1,752/13,654))
and to zebrafish (7.84% (1,098/14,014)), which suggests a
disentanglement of ancestral bidirectional promoters after each round of
WGD (two in tetrapods and three in teleosts). Consistently, the
majority of a set of 372 putatively ancestral, bidirectional promoters
were lost in vertebrates—particularly in stem vertebrates (54.5%)—with
only very few amphioxus-specific losses (5.3%) (Extended Data Fig. 4e, f).
Developmental DNA demethylation of APREs
Similar to other non-vertebrates17,18,19, the amphioxus genome exhibited very low levels of CpG methylation (Fig. 2a);
nearly all of the 5mC occurred in gene bodies, in which the proportion
of methylated CpGs correlated positively with gene-expression levels but
negatively with the density of H3K27me3 and H3K4me3 histone marks and
CpG dinucleotides (Extended Data Fig. 5a–c). However, as in zebrafish and frogs7, global levels of 5mC displayed a decrease during development (Extended Data Fig. 5d–g), coinciding with the onset of expression of the amphioxus orthologue of TET demethylase (Extended Data Fig. 5h).
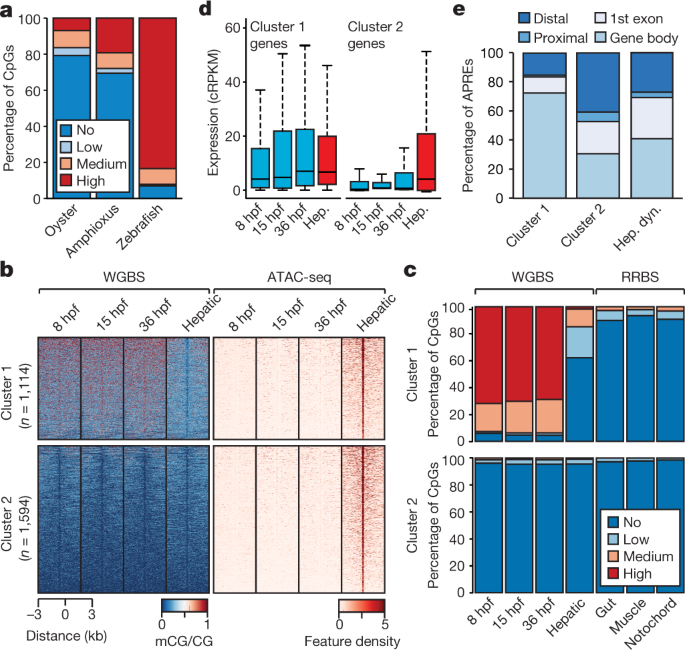
Fig. 2: 5mC patterns and dynamics in the amphioxus genome.
a, Percentage of methylated CpG dinucleotides in oyster (mantle, n = 14,779,123), amphioxus (8 hpf, n = 19,657,388) and zebrafish (1,000-cell stage, n = 38,989,847) samples. Low, >0–20%; medium, 20–80%; high, >80%. b, k-means clustering (n = 2) of 5mC signal over hepatic-specific APREs. c,
Percentage of methylated CpG dinucleotides as assessed by whole-genome
bisulfite sequencing (WGBS) and reduced representation bisulfite
sequencing (RRBS) in embryos and adult tissues in APREs from b. d, Distribution of expression levels for genes associated with APREs displaying distinct 5mC patterns in b.
Cluster 1: 1,114 genes; cluster 2: 1,594 genes. cRPKM, corrected (per
mappability) reads per kb of mappable positions and million reads. Hep,
hepatic diverticulum. e, Genomic distribution of regions with distinct 5mC patterns from b. Hep. dyn., dynamic APREs active in the hepatic diverticulum.
To
assess whether these 5mC dynamics may have regulatory potential, we
identified adult hepatic diverticulum-specific APREs that are inactive
during development. Unlike embryo-specific APREs (Extended Data Fig. 6a),
the clustering of these adult APREs on the basis of 5mC content
revealed two distinct subsets, one with hepatic-specific and one with
constitutive hypomethylation (Fig. 2b). Differentially methylated APREs (cluster 1) also displayed robust hypomethylation in other adult tissues (Fig. 2c),
which suggests that demethylation at these APREs occurs organism-wide.
Both groups of hepatic-specific APREs were enriched for binding sites of
liver-specific transcription factors—such as Hnf4a—as well as broadly
expressed transcription factors such as Foxa (Extended Data Fig. 6b), which is a pioneer factor that participates in 5mC removal at regulatory regions in mammals20.
APREs from both clusters were preferentially associated with genes with metabolic functions (Extended Data Fig. 6c).
However, only APREs with hepatic-specific hypomethylation (cluster 1)
were primarily associated with genes that displayed steady widespread
expression (Fig. 2d and Extended Data Fig. 6d, e); these APREs were mainly located within gene bodies (Fig. 2e).
These data suggest that demethylation of these APREs may contribute to
their identification as adult-specific, transcriptional cis-regulatory
elements within continuously hypermethylated gene-body contexts, which
is characteristic of non-vertebrate species. Fourteen zebrafish gene
families contained differentially methylated APREs in introns that are
orthologous to those identified in amphioxus—amongst these are four
genes that encode components of the Hippo pathway, including the
transcriptional effectors Yap (yap1 and wwtr1) and Tead (tead1a and tead3a) (Extended Data Fig. 6f, g).
The hourglass model and chordate embryogenesis
Previous comparative analyses among vertebrate transcriptomes21,22
showed a developmental period of maximal similarity in gene expression
that coincides with the so-called phylotypic period, consistent with the
hourglass model23.
However, similar comparisons with tunicates and amphioxus have thus far
not resolved a phylotypic period shared across all chordates22.
Pairwise comparisons of stage-specific RNA sequencing (RNA-seq) data
from developmental time courses of amphioxus against zebrafish, medaka,
frog (Xenopus tropicalis) and chicken revealed a consistent period of highest similarity (Fig. 3a, b and Extended Data Fig. 7)
that occurred slightly earlier than those reported for vertebrates; in
amphioxus, this corresponds to the neurula at the 4–7-somite stage
(18–21 hours post fertilization (hpf)). At the regulatory level,
pairwise comparisons between the relative enrichment of
transcription-factor motifs in sets of dynamic APREs that were active at
each stage were also consistent with an earlier hourglass model24 (Fig. 3c).
By contrast, at a shorter timescale, comparisons between different
species of amphioxus showed that the sequence conservation for the same
APREs was higher after the putative chordate phylotypic period (Fig. 3d).
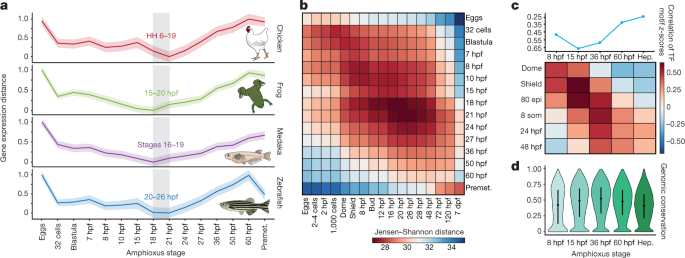
Fig. 3: The hourglass model and chordate embryogenesis.
a,
Stages of minimal transcriptomic divergence (using the Jensen–Shannon
distance metric) from four vertebrate species to each amphioxus stage.
The grey box outlines the period of minimal divergence, with the
corresponding vertebrate periods indicated (the range is given by the
two less divergent stages). Dispersions correspond to the standard
deviation computed on 100 bootstrap re-samplings of the orthologue sets
(amphioxus–chicken: 5,720; amphioxus–zebrafish: 5,673; amphioxus–frog:
5,883; and amphioxus–medaka: 5,288). HH, Hamburger–Hamilton stage. b,
Heat map of pairwise transcriptomic Jensen–Shannon distances between
amphioxus (vertical) and zebrafish (horizontal) stages. A smaller
distance (red) indicates higher similarity. dpf, days
post-fertilization. c, Zebrafish and amphioxus pairwise Pearson correlation of relative enrichment z-scores
for transcription-factor (TF) motifs in dynamic APREs, active at
different developmental stages. Top, maximal correlation for each
amphioxus stage against the zebrafish stages. Bottom, heat map with all
pairwise correlations. 80 epi, 80% epiboly stage; 8 som, 8-somite stage.
d, Sequence conservation levels within the cephalochordates of
active APREs at each developmental stage, visualized as the distribution
of average phastCons scores. The number of APREs at 8 hpf = 5,282; at
15 hpf = 17,387; at 36 hpf = 21,089; at 60 hpf = 22,674; and in hepatic
diverticulum (hep) = 16,551. Dots correspond to the mean values and lines represent the interquartile range.
Additional comparisons of embryo transcriptomes and neighbourhood analysis of conserved co-expression25
showed a high conservation of developmental and global expression
patterns and of gene functions between amphioxus and vertebrates
(Extended Data Fig. 8 and Supplementary Information).
Further pairwise comparison of co-regulated gene modules across tissues
between amphioxus and zebrafish revealed multiple pairs with highly
significant levels of orthologue overlap (Fig. 4a).
These included modules with conserved tissue-specific expression that
were enriched for coherent Gene Ontology categories, including genes
with high expression in organs with ciliated cells (for example,
spermatozoa and gill bars) (labelled ‘1’ in Fig. 4a–c) as well as neural, muscle, gut, liver, skin and metabolism-related modules (Supplementary Data 1). We also found a significant positive correlation between relative motif-enrichment scores for many pairs of modules (Fig. 4b);
the most-enriched transcription-factor motifs within each cluster were
highly consistent between amphioxus and zebrafish (Fig. 4d).
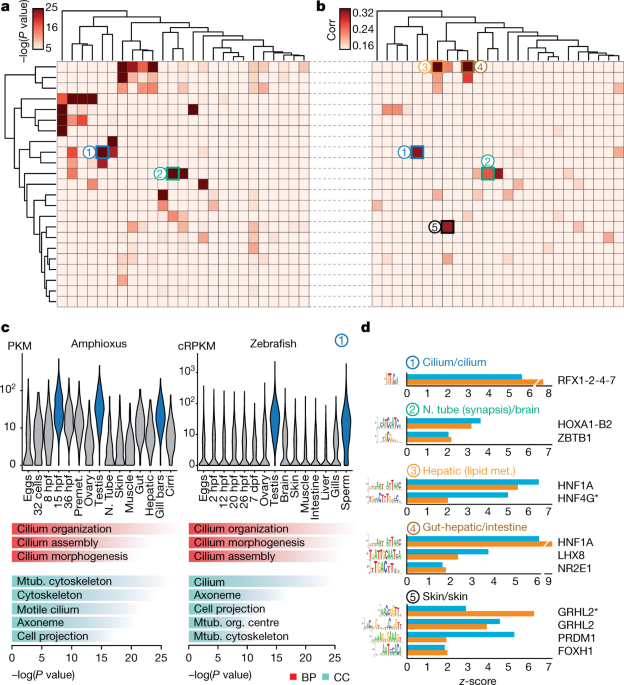
Fig. 4: Transcriptomic and cis-regulatory conservation of adult chordate tissues.
a,
Heat map showing the level of raw statistical significance of
orthologous gene overlap between modules produced by weighted
correlation network analysis (WGCNA), from amphioxus (vertical) and
zebrafish (horizontal) as derived from upper-tail hypergeometric tests. b, Heat map of all pairwise Pearson correlations (corr) between the modules of the two species, based on the relative z-scores of transcription-factor motifs for each module (242 super-families of motifs). Modules are clustered as in a. c,
Distribution of expression values (cRPKMs) for all genes within the
cilium modules across each sample (top), and enriched Gene Ontology
terms within each module (bottom) for a pair of modules (labelled ‘1’ in
b, c; 1,681 and 261 genes in zebrafish and amphioxus, respectively). BP, biological process; CC, cellular component. P
values correspond to uncorrected two-sided Fisher’s exact tests as
provided by topGO. Mtub., microtubule; N. tube, neural tube; org.,
organizing. d, Transcription-factor binding-site motifs with high z-scores
from highly correlated pairs of modules between zebrafish (blue) and
amphioxus (orange). Numbers correspond to those circles in b. RFX1-2-4-7 denotes RFX1, RFX2, RFX4 and RFX7; HOXA1-B2 denotes HOXA1 and HOXB2; asterisk denotes an alternative motif.
Higher regulatory information in vertebrate genomes
To
investigate the effect of WGDs on the evolution of vertebrate gene
regulation, we first asked whether the number of putative regulatory
regions per gene is higher in vertebrates than in amphioxus. We observed
significantly more APREs in the regulatory landscape of each gene (as
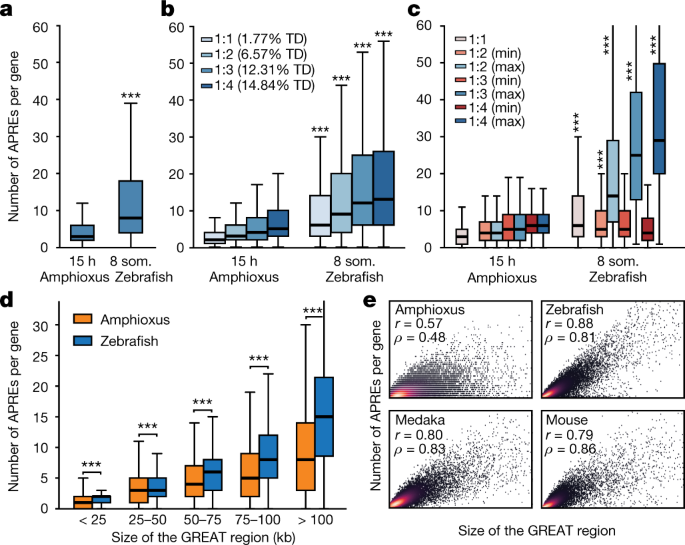
defined by the ‘Genomic Regions Enrichment of Annotations Tool’ (GREAT)26) in zebrafish than in amphioxus (Fig. 5a).
This difference is particularly evident for gene families that have
retained multiple copies after WGD (known as ohnologues; Fig. 5b),
for which the number of APREs is very uneven between copies, with
marked regulatory expansions observed for some ohnologues (Fig. 5c).
The same patterns were detected for all developmental stages of
amphioxus and zebrafish, as well as for medaka and mouse genomes, and
were highly robust to down-sampling of ATAC-seq coverage in vertebrates
(Extended Data Fig. 9a–c).
We also detected a higher number of peaks associated with regulatory
genes (‘trans-dev’ genes that are involved in the regulation of
embryonic development) compared to housekeeping genes in all species
(Extended Data Fig. 9d), consistent with the higher frequency of retention of trans-dev genes in multiple copies after WGD3 (Fig. 5b).
Comparison of regulatory landscapes—determined experimentally using
circular chromosome conformation capture followed by sequencing
(4C-seq)—for 58 genes from 11 trans-dev gene families in amphioxus,
zebrafish and mouse showed similar results (Extended Data Fig. 9e).
Fig. 5: Higher regulatory complexity in vertebrate regulatory landscapes.
a,
Distribution of the number of APREs within the regulatory landscape of
each gene (as estimated by GREAT), at comparable pre-phylotypic
developmental stages (15 hpf for amphioxus and 8 somites for zebrafish).
n = 6,047 and 9,239 genes for amphioxus and zebrafish, respectively. b, As in a,
but with gene families separated according to the number of retained
ohnologues per family in vertebrates (from 1 to 4, using mouse as a
reference). The percentage of developmental regulatory genes (TD,
trans-dev) in each category is indicated. c, As in b, but
only the genes with the lowest (‘min’, in red) and the highest (‘max’,
in blue) number of APREs are plotted for each ohnologue family. d,
Distributions of the number of APREs per gene among subsets of
amphioxus and zebrafish genes matched by GREAT-region size (± 500 bp)
and binned by size as indicated. e, Density scatter plot of the number of APREs (y axis) versus the size of the GREAT region (x axis) per gene and species. Pearson (r) and Spearman (ρ) correlation coefficients are indicated. Sample sizes: amphioxus, 20,053; zebrafish, 20,569; medaka, 15,978; mouse, 18,838. a–d, *** P < 0.001; one-sided Mann–Whitney tests of the zebrafish distribution versus the equivalent amphioxus distribution. Exact P values and sample sizes are provided in Supplementary Data 2, dataset 8.
As
expected, the higher number of APREs in zebrafish was associated with
larger intergenic regions in this species (Extended Data Fig. 9f).
However, the differences in APRE complements were not attributable only
to an increase in genome size in vertebrates, as subsets of amphioxus
and zebrafish genes with matched distributions of GREAT or
intergenic-region lengths also displayed a higher number of APREs in
zebrafish (Extended Data Fig. 9g, h).
Further investigation of matched distributions showed that these
differences were particularly great in genes with large regulatory
landscapes (>50 kb) (Fig. 5d). Thus, larger regions in amphioxus did not scale at the same rate as in vertebrates in terms of regulatory complexity (Fig. 5e), which is consistent with the overall lower proportion of distal APREs identified in this species (Fig. 1c, d).
In summary, these analyses reveal a large increase in the number of
regulatory regions during vertebrate evolution (and/or a decrease in
these regions in amphioxus)—particularly of distal regulatory
elements—and that this trend is enhanced for specific gene copies
retained after the WGDs, pointing to unequal rates of regulatory
evolution for different ohnologues.
More-complex regulation in specialized ohnologues
The
duplication–degeneration–complementation (DDC) model hypothesizes that
the retention of duplicate genes could be driven by reciprocal loss of
regulatory elements and restriction of paralogues to distinct subsets of
the ancestral expression pattern27.
In particular, the DDC model predicts that individual paralogues would
each have more restricted expression than an unduplicated outgroup, but
that their summation would not. To test this, we binarized the
expression (‘on’ or ‘off’) of each gene in nine homologous expression
domains in amphioxus, zebrafish, frog and mouse (Fig. 6a).
When comparing genes that returned to single-copy status after WGDs, we
detected no expression bias between amphioxus and vertebrates (Fig. 6a, b and Extended Data Fig. 10a, b).
By contrast, when vertebrate ohnologues were compared to their single
amphioxus orthologues, the distributions were strongly skewed and many
vertebrate genes displayed far more restricted expression domains (Fig. 6b and Extended Data Fig. 10a, b; similar results were obtained by comparing τ values28, Extended Data Fig. 10c–e).
The symmetrical pattern was fully recovered when the expression of all
vertebrate members was combined, or when the raw expression values were
summed for each member within a paralogy group (Fig. 6a, b and Extended Data Fig. 10a, b).
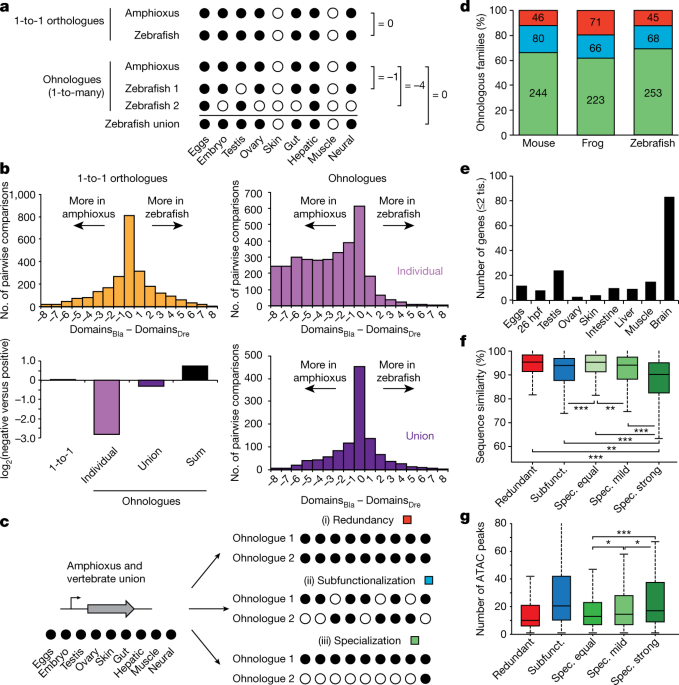
Fig. 6: Expression specialization is the main fate after WGD.
a, Schematic of the analysis shown in b. Expression is binarized for each gene across the nine homologous samples (‘on’, black dots; normalized cRPKM > 5). b, Distribution of the difference in positive domains between zebrafish (domainsDre) and amphioxus (domainsBla)
for 1-to-1 orthologues (2,478 gene pairs; yellow), individual
ohnologues (3,427 gene pairs in 1,135 families; lilac) and the union of
all vertebrate ohnologues in a family (purple). Bottom left, log2
of the ratio between zebrafish genes with negative and positive score
for each category. ‘Sum’ (black), binarization of family expression
after summing the raw expression values for all ohnologues. c, Schematic of the analyses shown in d, representing the three possible fates after WGD. d, Distribution of fates after WGD for families of ohnologues. e, Number of ohnologues with strong specialization in zebrafish expressed in each domain. Tis., tissue. f,
Distribution of the percentage of nucleotide sequence similarity
between human and mouse by family type. Ohnologues from specialized
families are divided into ‘spec. equal’ (which maintain all expression
domains), ‘spec. mild’ (which have lost some but maintained more than
two expression domains) and ‘spec. strong’ (≤2 expression domains
remain). Subfunct., subfunctionalized. g, Distribution of the
number of APREs within GREAT regions for zebrafish ohnologues for each
category. Only statistical comparisons within specialized families are
shown. P values in f and g correspond to two- and one-sided Wilcoxon sum-rank tests between the indicated groups, respectively. *0.05 > P value ≥ 0.01, ** 0.01 > P value ≥ 0.001, ***P value < 0.001. Exact P values and sample sizes are provided in Supplementary Data 2, dataset 8.
Although
the above findings are consistent with the DDC model, they are also
compatible with an alternative model in which a subset of duplicate
genes becomes more ‘specialized’ in expression pattern while one or more
paralogues retain the broader ancestral expression29.
To distinguish between these alternatives, we analysed a subset of
multi-gene families in which both the single amphioxus orthologue and
the union of the vertebrate ohnologues—and thus probably the ancestral
gene—were expressed across all nine samples that we compared. We then
identified (i) gene families in which all vertebrate paralogues were
expressed in all domains (termed ‘redundancy’), (ii) gene families in
which none of the vertebrate members had expression across all domains
(termed ‘subfunctionalization’)27
and (iii) gene families in which one or more vertebrate ohnologues were
expressed in all domains, but at least one ohnologue was not (termed
‘specialization’) (Fig. 6c). We obtained very similar results for the three vertebrate species we studied (Fig. 6d):
between 80 and 88% of gene families were subfunctionalized or
specialized, which implies that ancestral expression domains have been
lost in at least one member. Moreover, specialization was consistently
more frequent than subfunctionalization as a fate for ohnologues with
broad ancestral expression.
Ohnologues that have experienced
strong specialization (≤2 remaining expression domains) retained
expression more often in neural tissues (Fig. 6e and Extended Data Fig. 10f–i) and were generally not expressed in additional vertebrate-specific tissues (Supplementary Information). Furthermore, they showed the fastest rates of sequence evolution (Fig. 6f and Extended Data Fig. 10j–l),
consistent with an optimization of their coding sequence to perform
their function in a specific tissue and/or with the evolution of novel
functions (neofunctionalization). Ohnologues from specialized families
that have lost expression domains showed significantly more associated
APREs than ohnologues with the full ancestral expression (Fig. 6g).
We observed a strong positive relationship between the number of
ancestral expression domains lost and the number of APREs associated
with specialized ohnologues (Extended Data Fig. 10m).
This implies that the specialization of gene expression after WGD does
not occur primarily through loss of ancestral tissue-specific enhancers,
but rather by a complex remodelling of regulatory landscapes that
involves recruitment of novel, tissue-specific regulatory elements.
Discussion
By
applying functional genomics approaches to the cephalochordate
amphioxus, we have deepened our understanding of the origin and
evolution of chordate genomes. We identified APREs in amphioxus, the
activation of which is tightly associated with differential DNA
demethylation in adult tissues—a mechanism previously thought to be
specific to vertebrates. Additional cases may be subsequently found in
other non-vertebrate species when similar multi-omics datasets are
analysed. In amphioxus, APREs of this type usually fall within gene
bodies of widely expressed genes, which suggests that gene regulation by
demethylation could have originated as a mechanism to allow better
definition of enhancers in a hyper-methylated intragenic context. If so,
this mechanism could have been co-opted into new genomic contexts—that
is, distal intergenic enhancers—later in the evolution of vertebrate
genomes, which are characterized by their pervasive, genome-wide
hypermethylation.
We also found a consistently higher number of
open chromatin regions per gene in vertebrates than in amphioxus. This
pattern is observed at a genome-wide level, but is particularly evident
for distal APREs and in gene families that retain multiple ohnologues
after WGD; these families are enriched for regulatory genes with large
regulatory landscapes. Finally, we detected a large degree of
specialization in expression for retained ohnologues, with the vast
majority of multi-gene families with broad ancestral expression having
at least one member that restricted its expression breadth. Through this
mechanism, vertebrates have increased their repertoire of tightly
regulated genes, which has potentially contributed to tissue-specific
evolution. Gene-expression specialization was accompanied by faster
evolution of protein-coding sequences, and by an increase–rather than a
decrease—in the number of regulatory elements. Taken together, these
observations indicate that the two rounds of WGD not only caused an
expansion and diversification of gene repertoires in vertebrates, but
also allowed functional and expression specialization of the extra
copies by increasing the complexity of their gene regulatory landscapes.
We suggest that these changes to the gene regulatory landscapes
underpinned the evolution of morphological specializations in
vertebrates.
Methods
No
statistical methods were used to predetermine sample size. The
experiments were not randomized and investigators were not blinded to
allocation during experiments and outcome assessment.
Animal husbandry and embryo staging
Amphioxus gametes were obtained by heat stimulation as previously described30,31.
Embryos were obtained by in vitro fertilization in filtered seawater
and cultured at 19 °C. Staging was done based on previous publications32,33; correspondence between developmental stages and hpf are provided in Supplementary Table 1.
All protocols used for vertebrate species (zebrafish and medaka) have
been approved by the Institutional Animal Care and Use Ethic Committee
(PRBB–IACUEC, for CRG) or the Ethics Committee of the Andalusian
Government (license numbers 450-1839 and 182-41106, for CABD-CSIC), and
implemented according to national and European regulations. All
experiments were carried out in accordance with the principles of the
3Rs (replacement, reduction and refinement).
Genome sequencing and assembly
Genomic DNA was extracted from a single B. lanceolatum
adult male collected in Argeles-sur-Mer, France. The genome was
sequenced using a combination of Illumina libraries from a range of
inserts at Genoscope (897 million reads in total, with a paired-end
coverage of 150×; Supplementary Table 2). A diploid assembly was generated using SOAPdenovo assembler34 using a k-mer of 71. After gap closing, haplotypes were reconciled with Haplomerger35.
Genome annotation
We
generated deep coverage RNA-seq for 16 developmental stages and 9 adult
tissues (4.16 billion reads in total). The bulk of strand-specific
transcriptomic data was assembled de novo with Trinity36, aligned and assembled into loci with the PASA pipeline37. De novo gene models were built using Augustus38 and subsequently refined with EVM39
using PASA assemblies and aligned proteins from other species. In
parallel, all strand-specific RNA-seq reads were mapped to the genome
using Tophat240, assembled using Cufflinks41 and open reading frames were predicted using Trans-decoder42.
Models obtained using both these approaches were reconciled yielding a
total 218,070 transcripts from 90,927 unified loci, of which 20,569 were
protein-coding and had homologues in at least one of the other studied
species (see ‘Comparative genomics’). Gene Ontology (GO) terms were
assigned to amphioxus proteins based on their PFAM and Interpro domains,
as well as blastp hits against human proteins (1 × 10⁻⁶).
Repeats
were annotated and filtered with RepeatMasker using a custom library
generated with RepeatModeller. Long non-coding RNAs were identified by
filtering all transcripts for protein-coding potential using CPAT43
trained with zebrafish transcripts, and further discarding those that
had a positive hit in a HMM search against the NR and PFAM databases
(Extended Data Fig. 1g).
Comparative genomics
We used OMA44
to reconstruct gene families and infer homology relationships based on
well-established phylogenetic relationships between species45,
and further merged families sharing Ensembl paralogues with
‘Euteleostomi’ or ‘Vertebrata’ ancestry. To define the set of
high-confidence ohnologue families (Supplementary Data 2,
dataset 9), we retained families with two to four copies in three out
of five vertebrates (excluding teleosts) and subjected them to
phylogenetic reconciliation.
To assess genome sequence conservation, reciprocal whole-genome alignments of Branchiostoma floridae, Branchiostoma belcheri and B. lanceolatum were performed using LASTZ and processed with phastCons46
to produce conservation scores. The distribution of phastCons scores in
APREs was determined using ‘dynamic’ ATAC-seq peaks that showed no
temporal discontinuity in activity.
Comparative transcriptomics
To
investigate the evolutionary conservation of chordate development at
the molecular level, newly generated data from zebrafish, medaka and
amphioxus, as well as available data from the SRA (frog and chicken),
were compared (Supplementary Data 2, dataset 3 and Supplementary Table 3). Gene expression was estimated with Kallisto47 using Ensembl transcriptome annotations (Supplementary Table 4),
and summing up transcripts per million (TPMs) from all transcript
isoforms to obtain one individual gene-expression estimate per sample.
We used single-copy orthologues to pair genes and used the
Jensen–Shannon distance metrics after quantile normalization of TPMs to
score distance between pairs of transcriptomes:
Statistical
robustness towards gene sampling was assessed by calculating
transcriptomic distances based on 100 bootstrap replicates and
estimating the standard deviation over these replicates.
To obtain groups of genes with similar dynamics of expression during development, genes were clustered based on their cRPKMs48 using the Mfuzz package49.
For this purpose, eight comparable stages were selected in amphioxus
and zebrafish on the basis of conserved developmental landmarks such as
fertilization, gastrulation and organogenesis (Supplementary Table 5).
The statistical significance of the orthologous gene overlap between
pairs of clusters was assessed using upper-tail hypergeometric tests.
Modules of co-expressed genes across stages and adult tissues were inferred using WGCNA50 with default parameters in amphioxus (17 samples) and zebrafish (27 samples) (Supplementary Table 6).
The statistical significance of the orthologous gene overlap between
pairs of clusters was assessed using upper-tail hypergeometric tests.
The numbers of transcription-factor binding-site motifs detected in
APREs in the basal regions of genes from any given cluster were
standardized using z-scores.
To have a general assessment
of the extent of conservation or divergence in gene expression among
chordates at adult stages, we used neighbourhood analysis of conserved
co-expression (NACC)25,
a method developed to compare heterogeneous, non-matched sample sets
across species. NACC relies on comparisons of average distances between
pairs of orthologous (genes A and B), the 20 genes with the closest
transcriptomic distance (A¯ and B¯) and their reciprocal orthologues in the other species (AB¯¯¯¯¯¯¯¯ and BA¯¯¯¯¯¯¯¯), and is calculated as follows:
NACC=12[(AB¯¯¯¯¯¯¯¯−A¯)+(BA¯¯¯¯¯¯¯¯−B¯)]
NACC
calculations were performed for each family that contained a single
amphioxus member and up to eight members in zebrafish and were also
performed with randomized orthology relationships as a control.
Regulatory profiling
ATAC-seq
For
amphioxus, medaka and zebrafish, ATAC-seq was performed in two
biological replicates by directly transferring embryos in the lysis
buffer, following the original protocol51,52.
ATAC-seq libraries were sequenced to produce an average of 66, 83 and
78 million reads for amphioxus, zebrafish and medaka, respectively.
Reads were mapped with Bowtie2 and nucleosome-free pairs
(insert < 120 bp) retained for peak-calling using MACS253,
and the irreducible discovery rate was used to assess replicability.
Nucleosome positioning was calculated from aligned ATAC-seq data using
NucleoATAC54
Chromatin immunoprecipitation with sequencing (ChIP–seq)
Embryos of undetermined gender were fixed in 2% formaldehyde and ChIP was performed as previously described for other species55.
Chromatin was sonicated and incubated with the corresponding antibody
(H3K4me3: ab8580, H3K27ac: ab4729 and HeK27me3: ab6002, from Abcam). An
average of 30 million reads per library was generated. Reads were mapped
with Bowtie2 and peaks called with MACS253, assuming default parameters.
4C-seq
Embryos
of undetermined gender were fixed in 2% formaldehyde and chromatin was
digested with DpnII and Csp6. Specific primers targeted the TSSs of the
studied genes and included Illumina adapters. An average 5 million reads
were generated for each of the two biological replicates. After
mapping, reads were normalized per digestion fragment cut and
interactions were identified using peakC56 with low-coverage regions excluded.
MethylC-seq and RRBS
Genomic DNA was extracted as previously described57,
sonicated, purified and end-repaired. Bisulfite conversion was
performed with the MethylCode Bisulfite Conversion Kit (Thermo Fisher
Scientific). After Illumina library construction, an average of 73
million reads per sample were sequenced. RRBS libraries were prepared
similarly to those for MethyC-seq, but with restriction digestion with
MspI instead of sonication and PCR amplification. An average of 46
million reads per sample was generated. Reads were mapped to an in
silico, bisulfite-converted B. lanceolatum reference genome7,58. Differentially methylated regions in the CpG context were identified as previously described7. Differential transcription-factor motif enrichment was obtained with DiffBind from Bioconductor.
CAGE-seq
Libraries were constructed using the non-amplifying non-tagging Illumina CAGE protocol59. Mouse CAGE-seq data were obtained from FANTOM560. Reads were aligned using Bowtie. Nearby individual CAGE TSSs were combined using the distance-based clustering method in CAGEr61
to produce tag clusters, which summarize expression at individual
promoters. Tag clusters were clustered across samples to produce
comparable promoter regions, referred to as ‘consensus clusters’. The
consensus clusters were then grouped by expression patterns using a
self-organizing map62.
We investigated the relative presence and enrichment of the following
features: TATA box, YY1 motif, GC and AT content, SS and WW
dinucleotides, first exons and nucleosome positioning signal. Heat maps
were plotted for visualization by scanning either for exact dinucleotide
matches or for position weight matrix matches at 80% of the maximum
score. Position weight matrices for TATA and YY1 were taken from the
JASPAR vertebrate collection.
Cis-regulatory comparisons
Depending
on the analysis, an APRE was associated with a specific gene if it was
located within: (i) the ‘basal’ region of the gene (−5 kb to +1 kb of
the TSS; for comparisons of enriched motif composition) or (ii) the
GREAT region of the gene (up to ±1 Mb of the TSS unless another basal
region was found; for comparing the number of APREs per gene)26.
Stratification of gene sets by GREAT or intergenic-region size between
amphioxus and zebrafish was done using the function stratify from the
matt suite63, with a range of ±500 bp.
The
DNA-binding specificity of each transcription factor was predicted on
the basis of the binding domain similarity to other transcription-factor
family members, as previously performed64. Transcription-factor motifs from CIS-BP version 1.0264 were downloaded and clustered using GimmeMotifs65 (P ≤ 0.0001).
Two hundred and forty-two clusters of motifs were assigned to one or
more orthologous groups in both amphioxus and zebrafish and used for all
analyses (Supplementary Data 2, dataset 10). These motifs were detected in APREs using the tools gimme threshold and gimme scan from GimmeMotifs65.
Effect of WGDs on gene expression
Gene
expression was binarized (1 if the normalized cRPKM > 5, and 0
otherwise) across nine comparable samples in amphioxus and three
vertebrate species (mouse, frog and zebrafish) (Supplementary Table 7).
Then, for each amphioxus gene and vertebrate orthologue, the expression
bias was measured by subtracting the number of positive-expression
domains in amphioxus from that of vertebrates (Fig. 6a).
The amphioxus gene-expression pattern was also compared to the union of
the ohnologues, as well as the pattern after binarizing the expression
for the sum of cRPKM values of all family members. The analysis was
restricted to families with a single member in amphioxus
Next, we
selected those ohnologue families for which the ancestral expression
included the nine studied domains, as inferred from having expression in
the single amphioxus orthologue and in the union of the family. For
each gene family, we then defined (Fig. 6c):
(i) redundancy (all vertebrate paralogues were expressed in all
domains), (ii) subfunctionalization (none of the vertebrate members had
expression across all domains27),
and (iii) specialization (one or more vertebrate ohnologues were
expressed in all domains, but at least one ohnologue was not). Members
of the later type were subdivided into ‘strong’ and ‘mild’
specialization if they retained ≤ 2 or more expression domains. We
examined the transcript sequence similarity as well as the dN/dS between
human and mouse (retrieved from Biomart), and the number of APREs
associated with genes from different categories. Finally, we computed
the τ tissue-specificity index as previously described28, to assess more broadly the tissue specificity of ohnologues.
Transgenic assays in zebrafish and amphioxus
Enhancer reporter assays in zebrafish embryos were performed as previously described66. Selected peaks were first amplified, cloned into a PCR8/GW/TOPO vector and transferred into a detection vector (including a gata2 minimal promoter, a GFP reporter gene and a strong midbrain enhancer (z48) as an internal control)67. Transgenic embryos were generated using the Tol2 transposon and transposase method68. Three or more independent stable transgenic lines were generated for each construct as reported in Supplementary Table 8. For amphioxus reporter assays, selected peaks were amplified and transferred into a detection vector (including the Branchiostoma
minimal actin promoter, a GFP reporter gene and piggyBac terminal
repeats). Transgenic embryos were generated by the piggyBac transposase
method.
In situ hybridization
Gene
fragments that were synthetically designed or amplified by PCR from
cDNA were sub-cloned into pBluescript II SK and used as templates for
probe synthesis using the DIG labelling kit (Roche) and T3 RNA
polymerase. Embryos at different developmental stages were fixed in PFA
4% dissolved in MOPS–EGTA buffer and in situ hybridization carried out
as previously described69, using BCIP/NBT as a chromogenic substrate.
Next-generation sequencing data have been deposited in Gene Expression Omnibus (GEO) under the following accession numbers: GSE106372 (ChIP-seq), GSE106428 (ATAC-seq), GSE106429 (CAGE-seq), GSE106430 (RNA-seq), GSE102144 (MethylC-seq and RRBS) and GSE115945
(4C-seq). Raw genome sequencing data and the genome assembly have been
submitted to European Nucleotide Archive (ENA) under the accession
number PRJEB13665. UCSC hub and annotation files are available at http://amphiencode.github.io/.
Additional information
Publisher’s note: Springer Nature remains neutral with regard to jurisdictional claims in published maps and institutional affiliations.
References
1.
Bertrand, S. & Escriva, H. Evolutionary crossroads in developmental biology: amphioxus. Development138, 4819–4830 (2011).
Berthelot,
C., Villar, D., Horvath, J. E., Odom, D. T. & Flicek, P. Complexity
and conservation of regulatory landscapes underlie evolutionary
resilience of mammalian gene expression. Nat. Ecol. Evol. 2, 152–163 (2018).
Wang, X. et al. Genome-wide and single-base resolution DNA methylomes of the Pacific oyster Crassostrea gigas provide insight into the evolution of invertebrate CpG methylation. BMC Genomics15, 1119 (2014).
Albalat,
R., Martí-Solans, J. & Cañestro, C. DNA methylation in amphioxus:
from ancestral functions to new roles in vertebrates. Brief. Funct. Genomics11, 142–155 (2012).
Duboule,
D. Temporal colinearity and the phylotypic progression: a basis for the
stability of a vertebrate Bauplan and the evolution of morphologies
through heterochrony. Development1994 Suppl., 135–142 (1994).
Bogdanović,
O. et al. Dynamics of enhancer chromatin signatures mark the transition
from pluripotency to cell specification during embryogenesis. Genome Res. 22, 2043–2053 (2012).
Yanai,
I. et al. Genome-wide midrange transcription profiles reveal expression
level relationships in human tissue specification. Bioinformatics21, 650–659 (2005).
Sandve,
S. R., Rohlfs, R. V. & Hvidsten, T. R. Subfunctionalization versus
neofunctionalization after whole-genome duplication. Nat. Genet. 50, 908–909 (2018).
Fuentes, M. et al. Preliminary observations on the spawning conditions of the European amphioxus (Branchiostoma lanceolatum) in captivity. J. Exp. Zool. B Mol. Dev. Evol. 302B, 384–391 (2004).
Fuentes, M. et al. Insights into spawning behavior and development of the European amphioxus (Branchiostoma lanceolatum). J. Exp. Zool. B Mol. Dev. Evol. 308B, 484–493 (2007).
Hirakow, R. & Kajita, N. Electron microscopic study of the development of amphioxus, Branchiostoma belcheri tsingtauense: the gastrula. J. Morphol. 207, 37–52 (1991).
Hirakow, R. & Kajita, N. Electron microscopic study of the development of amphioxus, Branchiostoma belcheri tsingtauense: the neurula and larva. Kaibogaku Zasshi69, 1–13 (1994).
Keller,
O., Kollmar, M., Stanke, M. & Waack, S. A novel hybrid gene
prediction method employing protein multiple sequence alignments. Bioinformatics27, 757–763 (2011).
Haas,
B. J. et al. Automated eukaryotic gene structure annotation using
EVidenceModeler and the program to assemble spliced alignments. Genome Biol. 9, R7 (2008).
Trapnell,
C. et al. Transcript assembly and quantification by RNA-seq reveals
unannotated transcripts and isoform switching during cell
differentiation. Nat. Biotechnol. 28, 511–515 (2010).
Haas, B. J. et al. De novo transcript sequence reconstruction from RNA-seq using the Trinity platform for reference generation and analysis. Nat. Protocols8, 1494–1512 (2013).
Altenhoff,
A. M., Gil, M., Gonnet, G. H. & Dessimoz, C. Inferring hierarchical
orthologous groups from orthologous gene pairs. PLoS ONE8, e53786 (2013).
Labbé,
R. M. et al. A comparative transcriptomic analysis reveals conserved
features of stem cell pluripotency in planarians and mammals. Stem Cells30, 1734–1745 (2012).
Buenrostro,
J. D., Giresi, P. G., Zaba, L. C., Chang, H. Y. & Greenleaf, W. J.
Transposition of native chromatin for fast and sensitive epigenomic
profiling of open chromatin, DNA-binding proteins and nucleosome
position. Nat. Methods10, 1213–1218 (2013).
Fernández-Miñán,
A., Bessa, J., Tena, J. J. & Gómez-Skarmeta, J. L. Assay for
transposase-accessible chromatin and circularized chromosome
conformation capture, two methods to explore the regulatory landscapes
of genes in zebrafish. Methods Cell Biol. 135, 413–430 (2016).
Schep,
A. N. et al. Structured nucleosome fingerprints enable high-resolution
mapping of chromatin architecture within regulatory regions. Genome Res. 25, 1757–1770 (2015).
Bogdanović,
O., Fernández-Miñán, A., Tena, J. J., de la Calle-Mustienes, E. &
Gómez-Skarmeta, J. L. The developmental epigenomics toolbox: ChIP-seq
and MethylCap-seq profiling of early zebrafish embryos. Methods62, 207–215 (2013).
Geeven,
G., Teunissen, H., de Laat, W. & de Wit, E. peakC: a flexible,
non-parametric peak calling package for 4C and Capture-C data. Nucleic Acids Res. 46, e91 (2018).
Bogdanović,
O. & Veenstra, G. J. Affinity-based enrichment strategies to assay
methyl-CpG binding activity and DNA methylation in early Xenopus embryos. BMC Res. Notes4, 300 (2011).
Haberle,
V., Forrest, A. R., Hayashizaki, Y., Carninci, P. & Lenhard, B.
CAGEr: precise TSS data retrieval and high-resolution promoterome mining
for integrative analyses. Nucleic Acids Res. 43, e51 (2015).
van Heeringen, S. J. & Veenstra, G. J. GimmeMotifs: a de novo motif prediction pipeline for ChIP-sequencing experiments. Bioinformatics27, 270–271 (2011).
Bessa,
J. et al. Zebrafish enhancer detection (ZED) vector: a new tool to
facilitate transgenesis and the functional analysis of cis-regulatory regions in zebrafish. Dev. Dyn. 238, 2409–2417 (2009).
Somorjai,
I., Bertrand, S., Camasses, A., Haguenauer, A. & Escriva, H.
Evidence for stasis and not genetic piracy in developmental expression
patterns of Branchiostoma lanceolatum and Branchiostoma floridae, two amphioxus species that have evolved independently over the course of 200 Myr. Dev. Genes Evol. 218, 703–713 (2008).
Tena, J. J. et al. Comparative epigenomics in distantly related teleost species identifies conserved cis-regulatory nodes active during the vertebrate phylotypic period. Genome Res. 24, 1075–1085 (2014).
Acemel,
R. D. et al. A single three-dimensional chromatin compartment in
amphioxus indicates a stepwise evolution of vertebrate Hox bimodal
regulation. Nat. Genet. 48, 336–341 (2016).
This
research was funded primarily by the European Research Council (ERC)
under the European Union’s Horizon 2020 and Seventh Framework Program
FP7 research and innovation programs (ERC-AdG-LS8-740041 to J.L.G.-S.,
ERC-StG-LS2-637591 to M.I., a Marie Sklodowska-Curie Grant (658521) to
I.M. and a FP7/2007-2013-ERC-268513 to P.W.H.H.), the Spanish Ministerio
de Economía y Competitividad (BFU2016-74961-P to J.L.G.-S.,
RYC-2016-20089 to I.M., BFU2014-55076-P and BFU2017-89201-P to M.I. and
BFU2014-55738-REDT to J.L.G.-S, M.I. and J.R.M.-M), the ‘Centro de
Excelencia Severo Ochoa 2013-2017’(SEV-2012-0208), the ‘Unidad de
Excelencia María de Maetzu 2017-2021’(MDM-2016-0687), the People Program
(Marie Curie Actions) of the European Union’s Seventh Framework Program
FP7 under REA grant agreement number 607142 (DevCom) to J.L.G.-S., and
the CNRS and the ANR (ANR16-CE12-0008-01) to H.E. O.B. was supported by
an Australian Research Council Discovery Early Career Researcher Award
(DECRA; DE140101962). We acknowledge the support of the CERCA
Programme/Generalitat de Catalunya and of the Spanish Ministry of
Economy, Industry and Competitiveness (MEIC) to the EMBL partnership.
Additional sources of funding for all authors are listed in
Supplementary Information.
Reviewer information
Nature thanks D. Duboule and P. Flicek for their contribution to the peer review of this work.
Author information
Author notes
These
authors contributed equally: Ferdinand Marlétaz, Panos N. Firbas,
Ignacio Maeso, Juan J. Tena, Ozren Bogdanovic, Malcolm Perry
Affiliations
Department of Zoology, University of Oxford, Oxford, UK
Ferdinand Marlétaz
& Peter W. H. Holland
Molecular Genetics Unit, Okinawa Institute of Science and Technology Graduate University, Onna-son, Japan
Ferdinand Marlétaz
Centro Andaluz de Biología del Desarrollo (CABD), CSIC-Universidad Pablo de Olavide-Junta de Andalucía, Seville, Spain
Panos N. Firbas
, Ignacio Maeso
, Juan J. Tena
, Elisa de la Calle-Mustienes
, Rafael D. Acemel
, Silvia Naranjo
, Sandra Jimenez-Gancedo
, Lorena Buono
, Ensieh Farahani
, Juan Ramon Martinez-Morales
& Jose Luis Gómez-Skarmeta
Genomics and Epigenetics Division, Garvan Institute of Medical Research, Sydney, New South Wales, Australia
Ozren Bogdanovic
, Ksenia Skvortsova
& Paul Edward Duckett
St Vincent’s Clinical School, Faculty of Medicine, University of New South Wales, Sydney, New South Wales, Australia
Ozren Bogdanovic
Australian
Research Council Centre of Excellence in Plant Energy Biology, School
of Molecular Sciences, The University of Western Australia, Crawley,
Western Australia, Australia
Ozren Bogdanovic
& Ryan Lister
Institute of Clinical Sciences, Faculty of Medicine, Imperial College London, London, UK
Malcolm Perry
, Piotr J. Balwierz
& Boris Lenhard
Computational Regulatory Genomics, MRC London Institute of Medical Sciences, London, UK
Malcolm Perry
, Piotr J. Balwierz
& Boris Lenhard
Centre for Genomic Regulation (CRG), Barcelona Institute of Science and Technology (BIST), Barcelona, Spain
Christopher D. R. Wyatt
, Demian Burguera
, Yamile Marquez
, Jon Permanyer
& Manuel Irimia
Universitat Pompeu Fabra (UPF), Barcelona, Spain
Christopher D. R. Wyatt
& Manuel Irimia
Biologie
Intégrative des Organismes Marins, BIOM, Observatoire Océanologique,
CNRS and Sorbonne Université, Banyuls sur Mer, France
Stephanie Bertrand
, Daniel Aldea
, Yann Le Petillon
, Anthony Leon
, Lucie Subirana
, Vincent Laudet
& Hector Escriva
Department
of Genetics, Microbiology and Statistics, Faculty of Biology, and
Institut de Biomedicina (IBUB), University of Barcelona, Barcelona,
Spain
Demian Burguera
, Carlos Herrera-Ubeda
, Beatriz Albuixech-Crespo
& Jordi Garcia-Fernàndez
Department
of Molecular Developmental Biology, Faculty of Science, Radboud
Institute for Molecular Life Sciences, Radboud University, Nijmegen, The
Netherlands
Simon J. van Heeringen
Institute of Molecular Genetics of the Czech Academy of Sciences, Prague, Czech Republic
Iryna Kozmikova
& Zbynek Kozmik
Institut de Biologie de l’ENS, IBENS, Ecole Normale Supérieure, Paris, France
Alexandra Louis
& Hugues Roest Crollius
Inserm, U1024, Paris, France
Alexandra Louis
& Hugues Roest Crollius
CNRS, UMR 8197, Paris, France
Alexandra Louis
& Hugues Roest Crollius
Genoscope, Institut de biologie François-Jacob, Commissariat à l’Energie Atomique (CEA), Université Paris-Saclay, Evry, France
Jean-Marc Aury
& Sophie Mangenot
Génomique
Métabolique, Genoscope, Institut de biologie François Jacob,
Commissariat à l’Energie Atomique (CEA), CNRS, Université Evry,
Université Paris-Saclay, Evry, France
Patrick Wincker
Department
of Genetics, Microbiology and Statistics, Faculty of Biology and
Institut de Recerca de la Biodiversitat (IRBio), University of
Barcelona, Barcelona, Spain
Ricard Albalat
& Cristian Cañestro
Department of Zoology, University of Cambridge, Cambridge, UK
Èlia Benito-Gutiérrez
Interdisciplinary
Centre of Marine and Environmental Research (CIIMAR/CIMAR) and Faculty
of Sciences (FCUP), Department of Biology, University of Porto, Porto,
Portugal
Filipe Castro
Biology and Evolution of Marine Organisms, Stazione Zoologica Anton Dohrn Napoli, Naples, Italy
Salvatore D’Aniello
The Scottish Oceans Institute, Gatty Marine Laboratory, University of St Andrews, St Andrews, UK
David E. K. Ferrier
State Key Laboratory of Biocontrol, School of Life Sciences, Sun Yat-sen University, Guangzhou, China
Shengfeng Huang
& Anlong Xu
Laboratoire de Biométrie et Biologie Evolutive (UMR 5558), CNRS and Université Lyon 1, Villeurbanne, France
Gabriel A. B. Marais
IRD,
APHM, Microbe, Evolution, PHylogénie, Infection, IHU Méditerranée
Infection and CNRS, Aix Marseille University, Marseille, France
Pierre Pontarotti
Sorbonne
Université, CNRS, Laboratoire de Biologie du Développement de
Villefranche-sur-Mer, Institut de la Mer de Villefranche-sur-Mer,
Villefranche-sur-Mer, France
Michael Schubert
UMR 9002 CNRS, Institut de Génétique Humaine, Université de Montpellier, Montpellier, France
Hervé Seitz
Biomedical Sciences Research Complex, School of Biology, University of St Andrews, St Andrews, UK
Ildiko Somorjai
School of Medical Sciences, Faculty of Biology, Medicine and Health, University of Manchester, Manchester, UK
Tokiharu Takahashi
INSERM U830, Équipe Labellisée LNCC, SIREDO Oncology Centre, Institut Curie, PSL Research University, Paris, France
Olivier Mirabeau
School of Life Sciences, Beijing University of Chinese Medicine, Beijing, China
Anlong Xu
Institute of Cellular and Organismic Biology, Academia Sinica, Taipei, Taiwan
Jr-Kai Yu
RIKEN Center for Life Science Technologies (Division of Genomic Technologies) (CLST DGT), Yokohama, Japan
Piero Carninci
Laboratory for Transcriptome Technology, RIKEN Center for Integrative Medical Sciences, Yokohama, Japan
Piero Carninci
Center
for Autoimmune Genomics and Etiology, Divisions of Biomedical
Informatics and Developmental Biology, Cincinnati Children’s Hospital
Medical Center, Cincinnati, OH, USA
Matthew T. Weirauch
Department of Pediatrics, University of Cincinnati College of Medicine, Cincinnati, OH, USA
Matthew T. Weirauch
Harry Perkins Institute of Medical Research, Nedlands, Western Australia, Australia
Ryan Lister
Sars International Centre for Marine Molecular Biology, University of Bergen, Bergen, Norway
Boris Lenhard
Contributions
F.M.,
P.N.F., I.M., J.J.T., O.B., M.P., B.L., P.W.H.H., H.E., J.L.G.-S. and
M.I. contributed to concept and study design. F.M., P.N.F., I.M.,
J.J.T., O.B., M.P., C.D.R.W., R.D.A., S.J.v.H., C.H.-U., K.S., Y.M., A.
Louis, P.J.B., P.E.D., M.T.W., J.G.-F., R.L., B.L., P.W.H.H., J.L.G.-S.
and M.I. performed computational analyses and data interpretation. O.B.,
E.d.l.C.-M., S.B., D.B., R.D.A., S.N., S.J.-G., D.A., L.B., J.P.,
B.A.-C., Y.L.P., A. Leon, L.S., E.F., P.C., J.R.M.-M., R.L., B.L., H.E.,
J.L.G.-S. and M.I. obtained biological material and generated
next-generation sequencing data. I.M., J.J.T., E.d.l.C.-M., I.K.,
R.D.A., Z.K. and J.L.G.-S. performed transgenic assays. J.-M.A., S.M.
and P.W. sequenced the genome. R.A., E.B.-G., C.C., F.C., S.D.,
D.E.K.F., S.H., V.L., G.A.B.M., P.P., M.S., H.S., I.S., T.T., O.M., A.X.
and J.-K.Y. contributed to genome sequencing and gene family curation.
I.M., H.E., J.L.G.-S. and M.I. coordinated the project. F.M., I.M.,
P.W.H.H. and M.I. wrote the main text, with input from all authors.
Detailed contributions are listed in Supplementary Information. Animal
illustrations by J.J.T., released under a Creative Commons Attribution
(CC-BY) Licence.
Nenhum comentário:
Postar um comentário
Observação: somente um membro deste blog pode postar um comentário.
Nenhum comentário:
Postar um comentário
Observação: somente um membro deste blog pode postar um comentário.